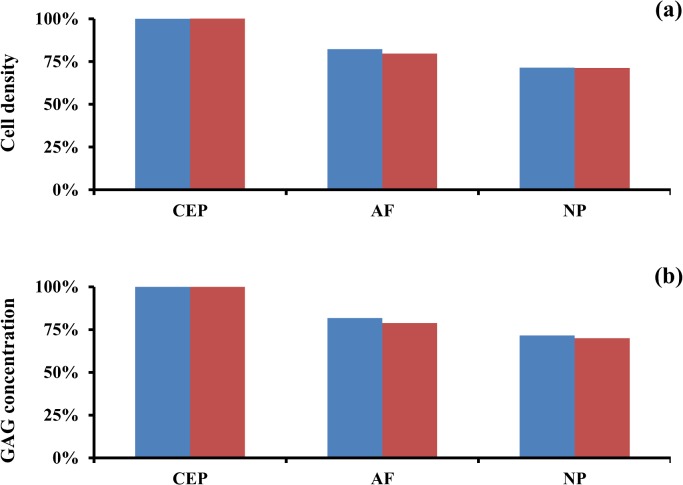
Fig 6. Effect of reduction of solute supply to IVD due to tobacco smoking on disc homeostasis.
(A) Change in cell density in IVD regions. (B) Change in GAG levels in IVD regions. Data are normalized with respect to the ‘non-smoking’ scenario. Data in blue refer to ‘light smoking’ scenario, those in red to ‘heavy smoking’ scenario.

