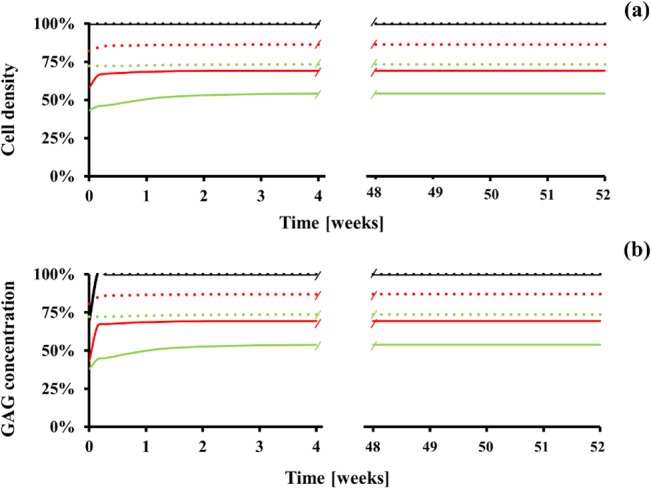
Fig 8. IVD homeostasis partially recovers at 1 year after quitting smoking.

(A) Change in cell density. (B) Change in GAG concentration. Data are normalized with respect to the ‘non-smoking’ scenario and refer to the CEP (black line), the AF (red line), and the NP (green line). Dotted lines refer to ‘light smoking’ scenario, solid lines (red) to ‘heavy smoking’ scenario.
