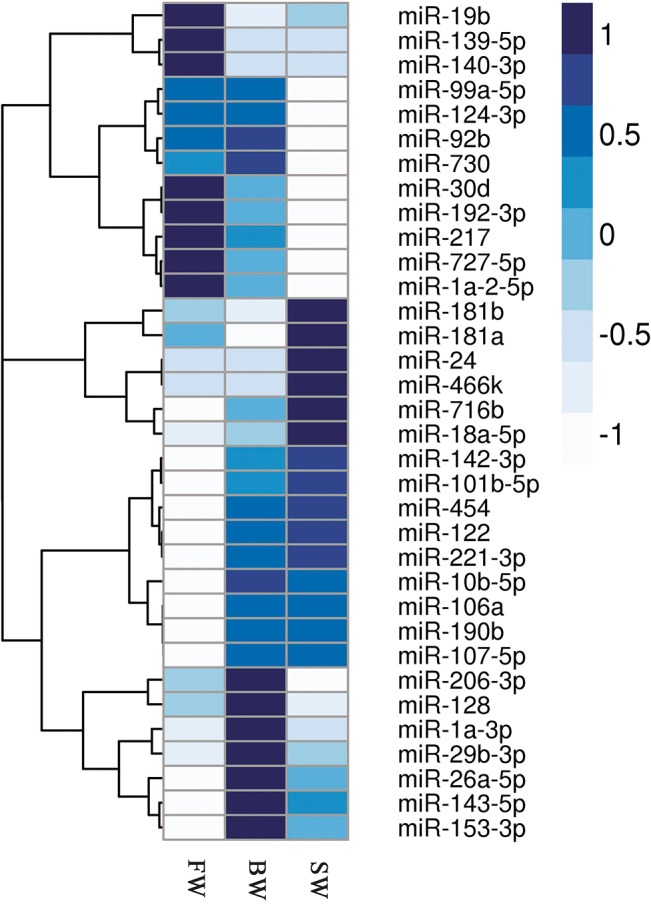
Fig 4. Hierarchical clustering of conserved miRNAs differentially expressed in three different salinities.

The heat map is drawn with log2(NE+1) of each miRNA. Color map is used to distinguish the difference in the expression of miRNAs.

The heat map is drawn with log2(NE+1) of each miRNA. Color map is used to distinguish the difference in the expression of miRNAs.