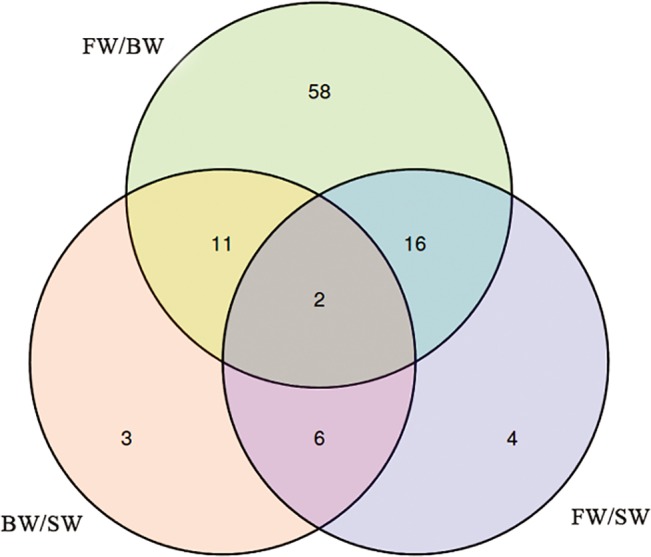
Fig 6. Venn diagram comparing the expression distribution of miRNAs in BW compared with FW, in SW compared with FW and in SW compared with BW.

Numbers in parentheses represent the numbers of co-expressed or differentially expressed pre-miRNAs.

Numbers in parentheses represent the numbers of co-expressed or differentially expressed pre-miRNAs.