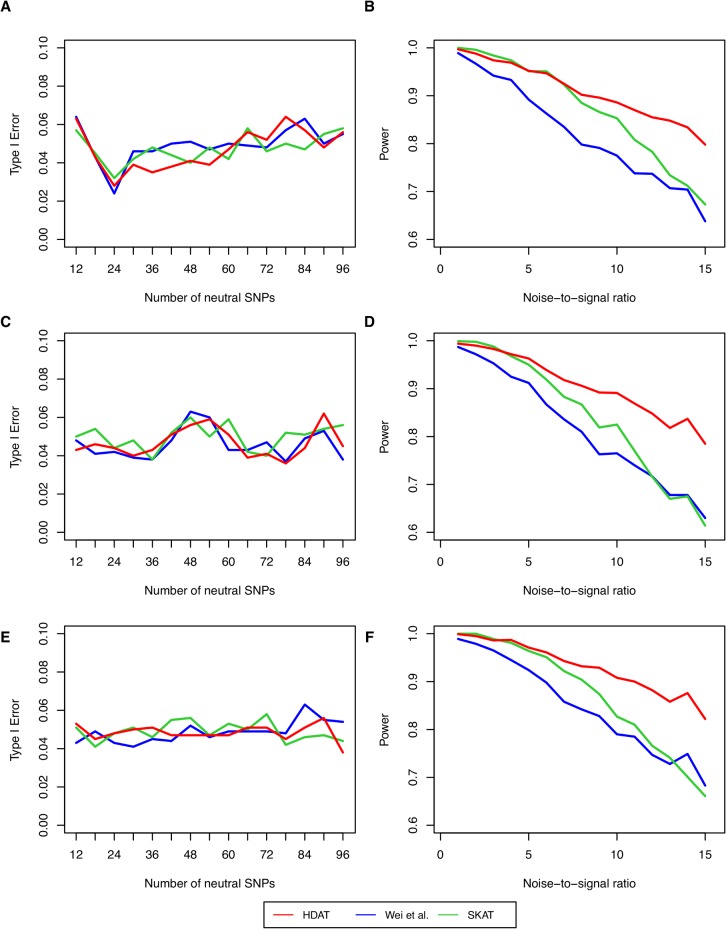
Fig 3. Type I error and power in simulations.
Type I error (A, C, E) and power (B, D, F) of the Hamming distance-based association test HDAT (red line), the U-statistic (blue line) and SKAT (green line) for the SNP-set association test under different noise-to-signal ratios, and effect sizes. The X-axis stands for the numbers of neutral SNPs in (A), (C) and (E), but the noise-to-signal ratios in (B), (D) and (F). The effects of causal SNPs are deleterious in (A) and (B), protective in (C) and (D), and mixture in (E) and (F). The simulation included 100 cases and 100 controls.

