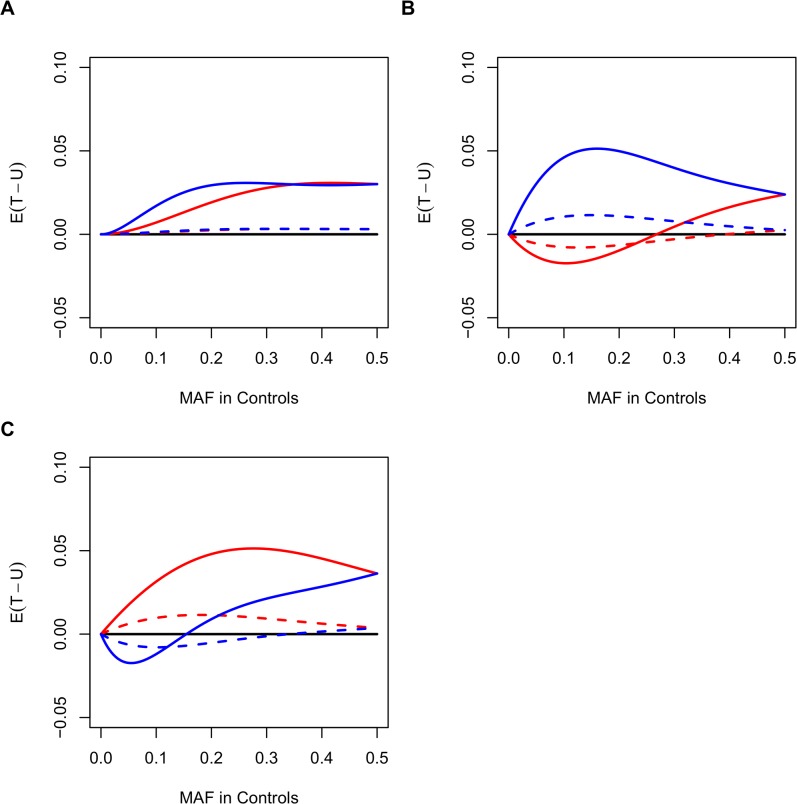
Fig 9. Expected values of the test statistic.
Expected values of the test statistic under different MAFs in controls, ORs, and case-to-control ratios based on one single SNP. (A) Case-to-control ratio is 1:1 (1000:1000). (B) 1:1.5 (1000:1500). (C) 1.5:1 (1500:1000). Red solid line for protective SNPs with OR = 0.5, red dashed line for OR = 0.8, blue solid line for OR = 2, and blue dashed line for OR = 1.25.

