
Fig 3. Insulin Expression Profile.
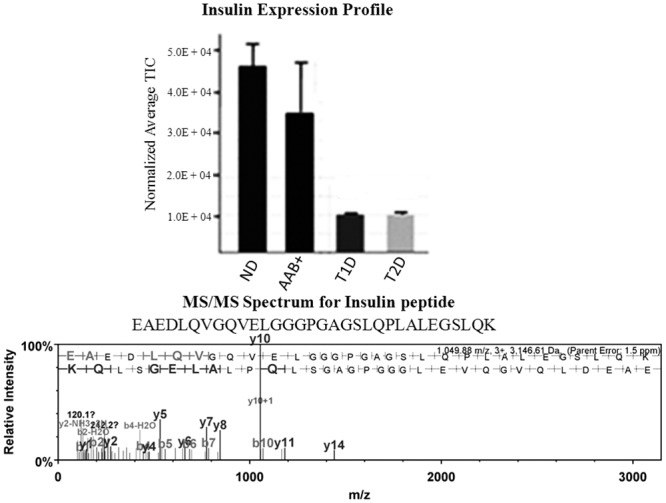
Normalized average total ion chromatogram for insulin in ND, AAb+, T2D and T1D cases were determined. Insulin is significantly downregulated in the T1D and T2D cases. Student’s t-test is used for statistical analysis. All data are mean ± SEM. *P<0.05. The mass spectrum for a representative insulin peptide (m/z, 1049.88 (+3)) with sequence EAEDLQVGQVELGGGPGAGSLQP LALEGSLQK is shown in the lower panel.