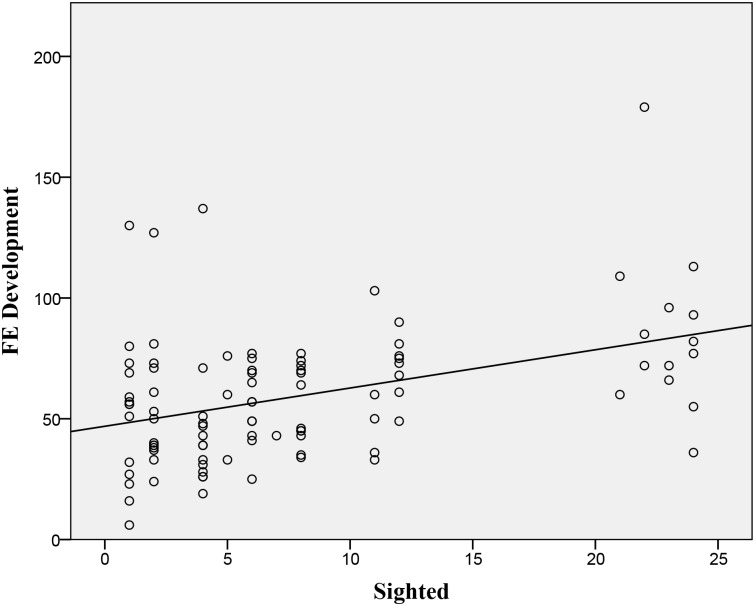
Fig 5. Development Time: Scatterplot of actual sighted whirligigs in a population of 24 on FE development (time to expand during FE).
Development time is given in mean frames (1/30 s) between first startle to the time of maximum expansion (n = 105 groups, statistics are shown in Table 1). The linear regression line is shown (Y = 1.6*X + 46.9).

