
Fig 3. Content of ABA, CK, IAA and GA during A. chinensis ‘Hongyang' fruit development through HPLC-MS.
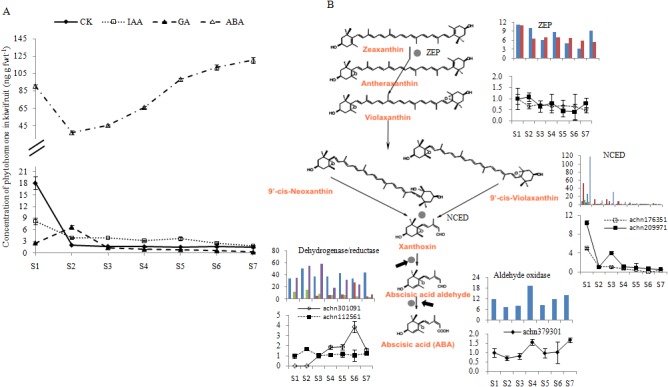
A Phytohormone levels during kiwifruit development. Phytohormone concentration values are means of five replicates. fwt, fresh weight. B The transcript levels of some genes committed to ABA biosynthesis. The Y axes of inserted bar graphs are PRKM value from the transcriptome data, and of inserted broken line graphs are the relative expression abundance through qRT-PCR from three biological replicates. ZEP, zeaxanthin epoxidase. NCED, 9-cis-epoxycarotenoid dioxygenases. Error bars represent SE.