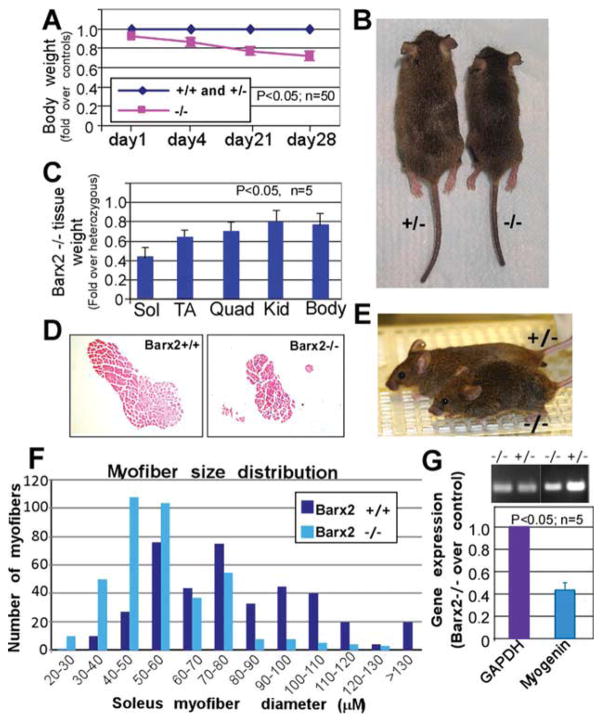
Figure 2.
Analysis of postnatal muscle growth in Barx2 mutant mice. (A): Between 1 and 28 days, Barx2−/− pups show significant reduction in growth as indicated by total body weight relative to Barx2+/+ and Barx2+/− littermates. The averaged weights of the wild-type and heterozygous mice were taken as the baseline. The statistical difference was observed at p < .05, n, number of mice per genotype. (B): Typical appearance of Barx2+/− and Barx2−/− mice at 28 days (wild-type and heterozygous mice are indistinguishable). (C): Sol, TA, and Quad muscles from four pairs of 4-week old Barx2−/− and Barx2+/− littermates were harvested and weighed (n, number of mice). (D): Transverse sections of Sol muscle from wild-type and Barx2−/− mice were stained with hematoxylin and eosin. (E): Example of a 16-month-old Barx2 null mouse displaying a hunched back and splayed stance relative to a heterozygous control mouse. (F): Histogram demonstrating the distribution of myofiber sizes in Barx2−/− and Barx2+/+ mice. Maximal myofiber diameters were measured in transverse sections of Sol muscle from three mice for each genotype; number of myofibers. n = 396 for Barx2+/+ and 392 for Barx2−/−. (G): Expression of the muscle differentiation marker myogenin is reduced in muscles from 4-week-old Barx2−/− mice relative to Barx2+/− littermates as indicated by semiquantitative RT-PCR (n, number of mice). GAPDH is used as a reference standard. Abbreviations: GAPDH, glyceraldehyde-3-phosphate dehydrogenase; Kid, kidney; Quad, quadriceps; RT-PCR, reverse transcriptase polymerase chain reaction; Sol, Soleus; TA, tibialis anterior.

