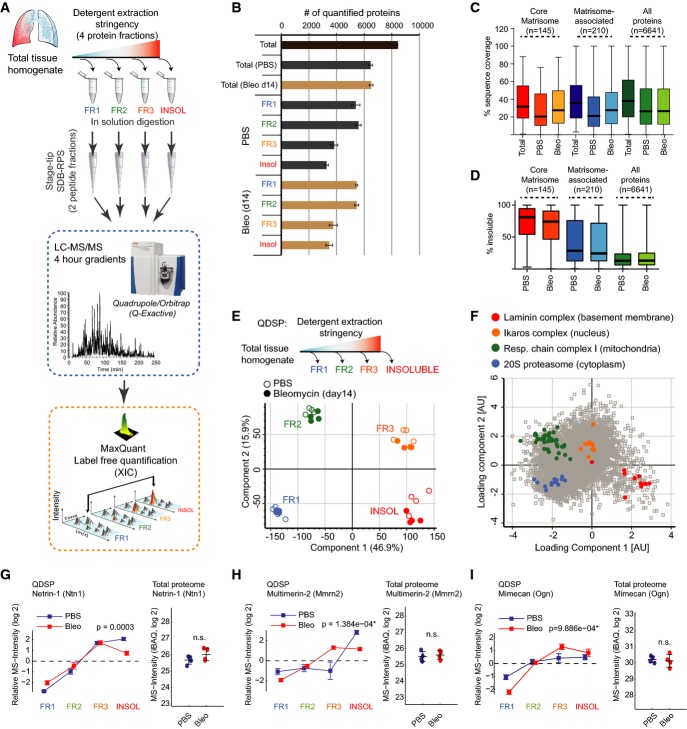
Figure 1.
Quantitative detergent solubility profiling (QDSP) enables in-depth analysis of matrisome composition
- A Experimental workflow.
- B Number of quantified proteins in the indicated protein fractions and experimental conditions. The mean and standard deviation are shown (PBS, n = 4; Bleo d14, n = 4).
- C, D The box and whisker plots depict the distribution of protein sequence coverage (coverage of possible tryptic peptides per protein in %) (C) or the percentage of MS intensity in the most insoluble protein fraction (D) for the indicated matrisome categories (Naba et al, 2012a) and experimental conditions.
- E Principal component analysis (PCA) separates protein fractions derived from sequential detergent extraction. The first two components of data variability of 6,641 proteins, from four replicates of PBS control (open circles) and four replicates of bleomycin-treated lungs at day 14 after injury (closed circles), are shown.
- F The scatter plot depicts the protein feature loadings of component 1 and component 2 of the PCA in (E) for the four indicated multiprotein complexes.
- G–I Normalized QDSP MS intensity profiles (left panel) and total protein abundance (right panel) are shown for the indicated example proteins Netrin-1 (G), Multimerin-2 (H), and Mimecan (I). Error bars depict the standard error of the mean, and the indicated P-values are derived from an ANOVA test (all fractions: PBS, n = 4; Bleo d14, n = 4).

