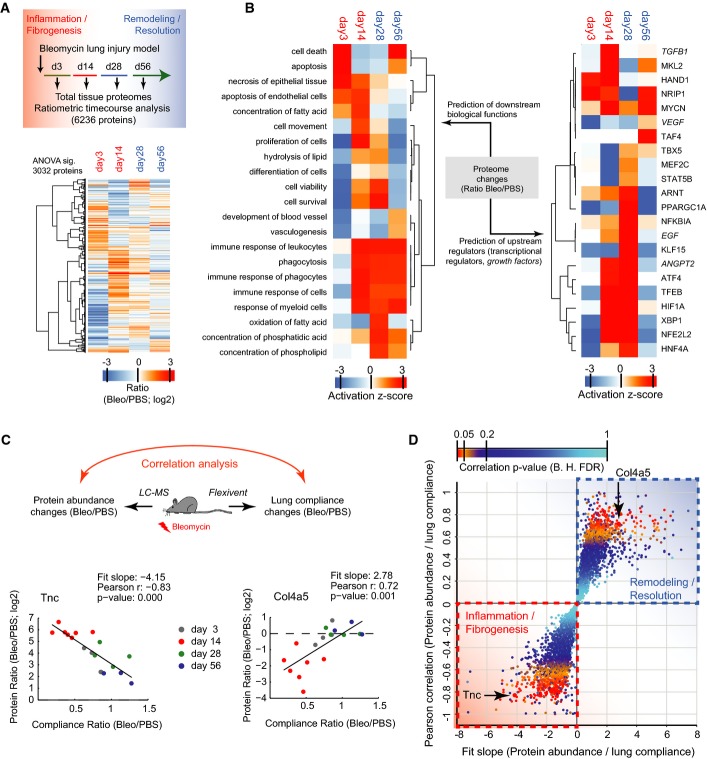
Figure 4.
Tissue proteome time course analysis reveals lung injury repair protein signatures
- Schematic of experimental design and hierarchical clustering analysis of 3,032 MS intensity ratios (Bleo/PBS; log2) that were significant in ANOVA (day 3, n = 3; day 14, n = 7; day 28, n = 4; day 56, n = 3).
- Hierarchical clustering of the activity score of downstream biological functions (left panel) and the upstream transcriptional regulators and growth factors (right panel) for the indicated time points after injury as determined by Ingenuity pathway analysis using the 3,032 significant protein ratios.
- Correlation of protein abundance changes with lung compliance changes in individual mouse lungs at the indicated time points after bleomycin instillation into the airways. The ECM glycoprotein Tnc serves as an example for proteins that have a negative slope of the correlation fit. The basement membrane protein Col4a5 serves as an example for proteins that have a positive slope of the correlation fit.
- The scatter plot depicts the Pearson correlation coefficient and the correlation fit slope of all 6,236 proteins that were used in the ratiometric analysis of protein abundance versus lung compliance. The statistical significance of the correlation coefficient is color-coded as indicated.

