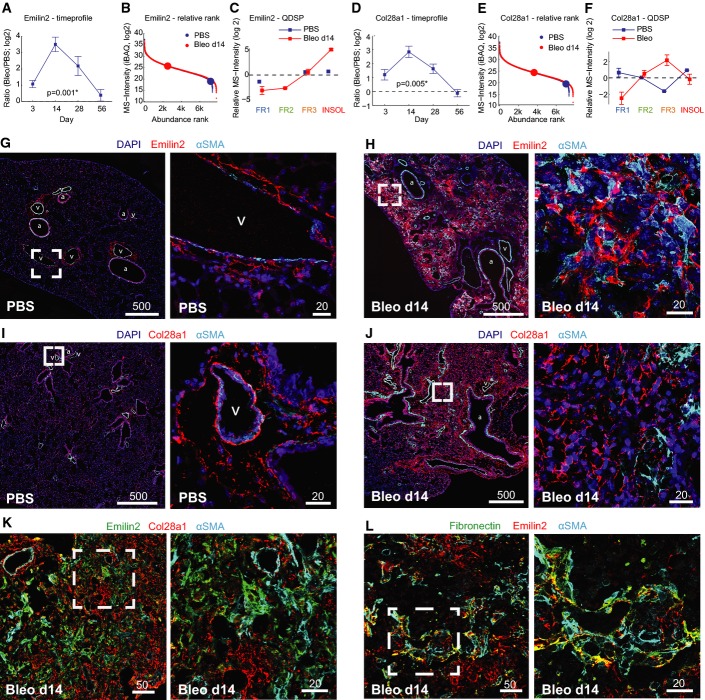
Figure 6.
Validation of novel ECM proteins strongly upregulated upon lung injury
- A–F Quantitative proteome data depict protein abundance changes over time relative to healthy control mice (A, D), the abundance rank relative to all other quantified proteins (b, e), and the QDSP profiles indicative for the detergent solubility (C, F). The mean and standard error of the mean are shown (day 3, n = 3; day 14, n = 7; day 28, n = 4; day 56, n = 3).
- G–L Lung tissue sections from control mice (PBS) and bleomycin-treated mice 2 weeks after injury (Bleo d14) were stained as indicated. Scale bars are in μm. Vessels are labeled with (v) and airways with (a).

