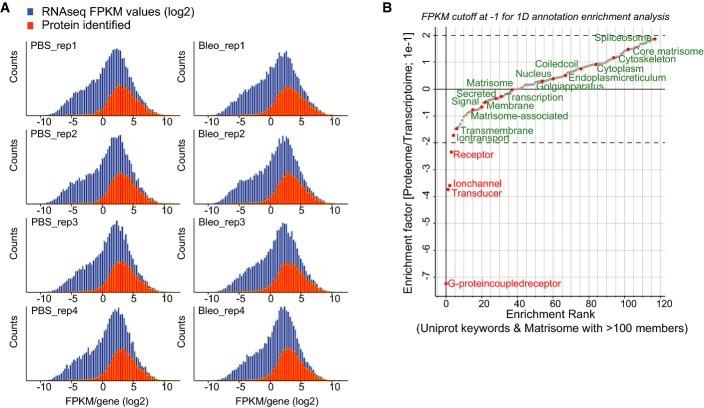
Figure EV3.
Combined proteomic and transcriptomic analyses of tissue fibrogenesis
- The histogram shows the distribution of the FPKM values from the RNA-seq experiment in log2 space (blue bars). The orange bars show the distribution of FPKM values for a total of 6,672 genes for which we also quantified the corresponding protein.
- Relative enrichment (coverage) of the indicated gene categories (UniProt keywords) in the proteome and transcriptome was calculated using the 1D annotation enrichment algorithm embedded in the Perseus software suite. The enrichment is normalized to a score spanning from −1 to 1 as indicated. Gene categories are ranked according to their relative enrichment in the transcriptome or proteome (PBS, n = 4; Bleo day 14, n = 4).

