
Figure EV6.
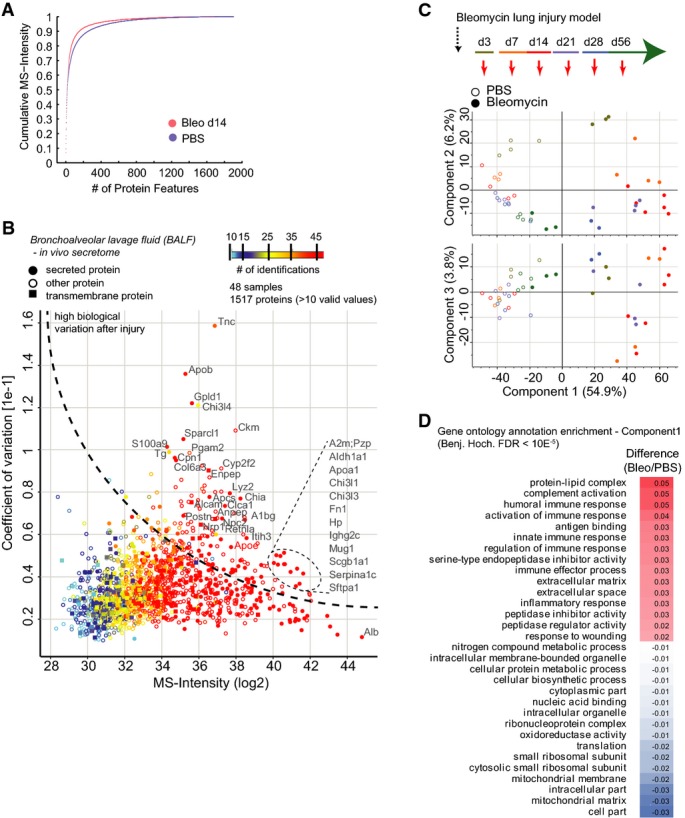
Proteomic analysis of bronchoalveolar lavage fluid upon bleomycin injury
- The mean cumulative MS intensity of the indicated conditions demonstrates differences in dynamic range of protein copy numbers (PBS, n = 24; Bleo day 14, n = 7). The lower number after bleomycin treatment was likely due to the leakage of plasma through the endothelial barrier upon injury, which makes MS analysis more challenging.
- The scatter plot depicts the median MS intensity versus the coefficient of variation across the injury time course and all replicates, which highlights proteins with high biological variation upon injury. The number of protein identifications across replicates and time points (n = 48) is color-coded, and secreted and transmembrane proteins are marked with the indicated symbols.
- Principal component analysis of BALF proteomes from the indicated experimental conditions and time points separates experimental groups.
- The table shows significantly regulated gene ontology terms (FDR < 2%) that were found to be enriched in either the negative (PBS) or positive (Bleo) data dimension of component 1 in the principal component analysis shown in (C).