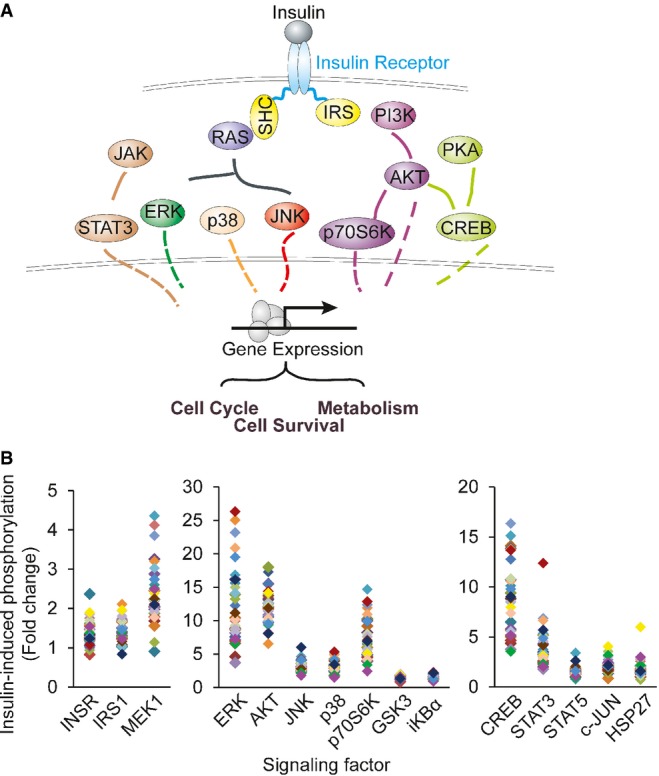
Figure 2.

Insulin-induced phosphorylation of multiple signaling factors
- Schematic diagram of the factors along insulin signaling pathways.
- Results from Luminex assays show phosphorylation of the signaling factors 10 min following insulin treatment. Each individual is represented with a different color. Average phosphorylation levels of the biological duplicates from the same individual are shown.
Source data are available online for this figure.
