
Figure 3.
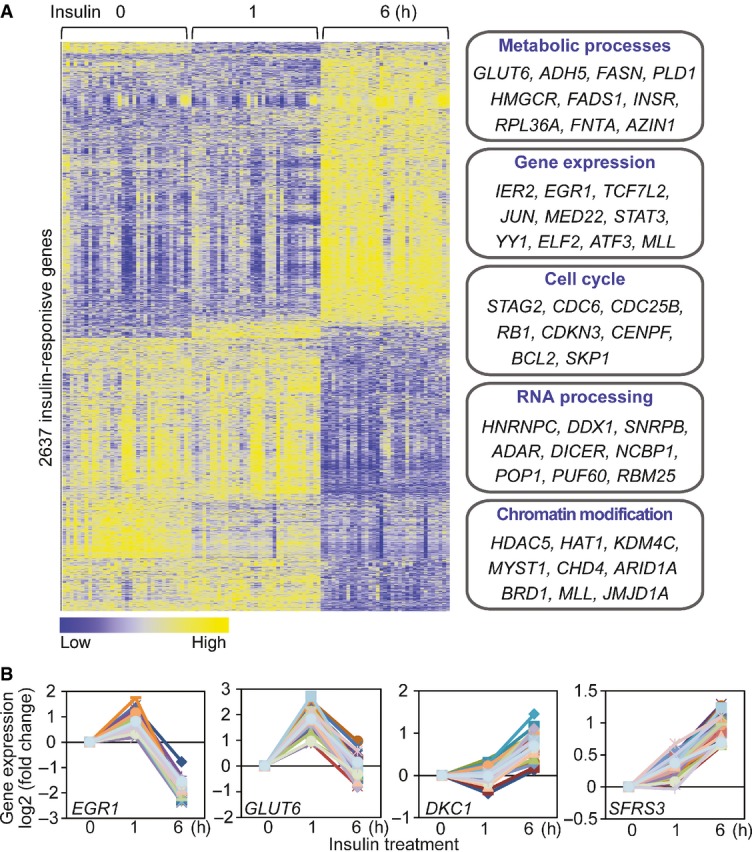
Insulin-induced changes in gene expression
- Heatmap shows the expression levels of 2,637 insulin-responsive genes (P < 10−6; ANOVA). Examples of genes that are involved in various biological processes are listed.
- Examples of insulin-responsive genes, including those known to be regulated by insulin (EGR1, GLUT6), and those that were not previously implicated in insulin response (DKC1, SFRS3).