Figure 4.

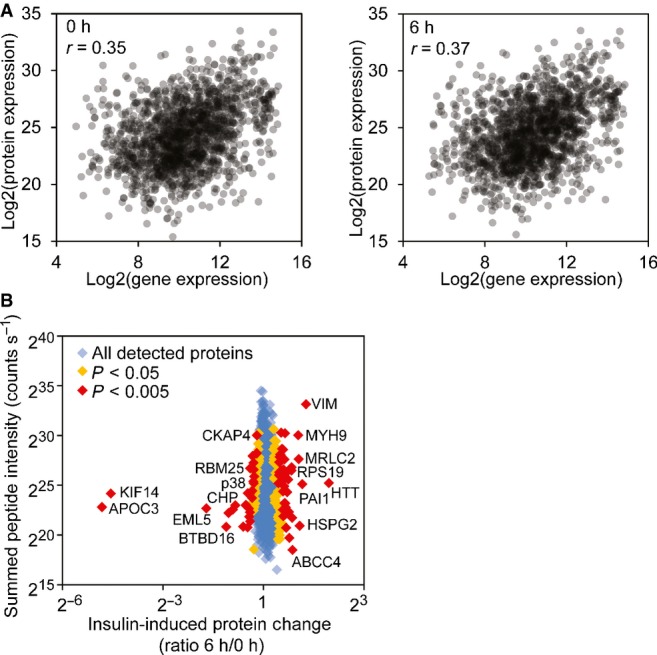
Insulin-induced changes in protein expression
- Correlations of protein and gene expression levels before and after insulin treatment. The gene expression levels are averages from our 35 subjects.
- Protein expression changes after insulin treatment quantified by mass spectrometry (SILAC). Examples of proteins with significant changes of expression are annotated (MaxQuant Significance B statistical test).
Source data are available online for this figure.
