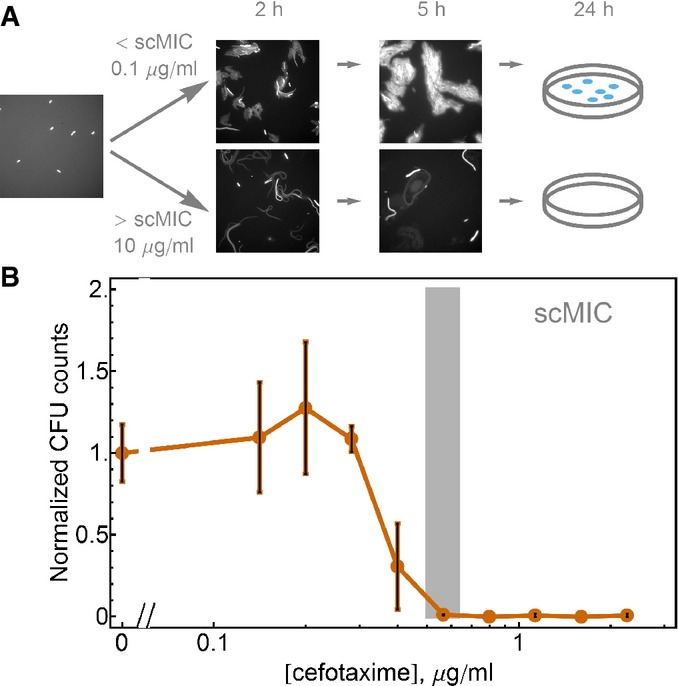
Figure 2.

scMIC is the MIC of a single cell
- The diagram of the time evolution of cell density on the surface of the agar media at two antibiotic concentrations: below (the top row of images) and above (the bottom row of images) the scMIC of the imaged strain (reference strain). We initially pipette diluted saturated culture on the surface of the agar (0.4%) and take an image on which we can see distinct single cells scattered on the surface. While at antibiotic concentration below the scMIC, an exponential growth of cells is happening during the first 5 h, at the antibiotic concentration above the scMIC, cells undergo filamentation and do not form colonies in 1 day.
- The scMIC can also be estimated by plating cells on agar and counting colony growth after overnight incubation. Saturated cultures of the reference strain TEM-20 were evenly spread on agar plates with various cefotaxime concentrations. The colony-forming units (CFU) were evaluated for two independent cultures and normalized by the CFU obtained without antibiotics. The error bars are the maximum of the two Poissonian errors for zero antibiotic concentration and the standard error of the mean for all non-zero antibiotic points.
Source data are available online for this figure.
