
Figure 5.
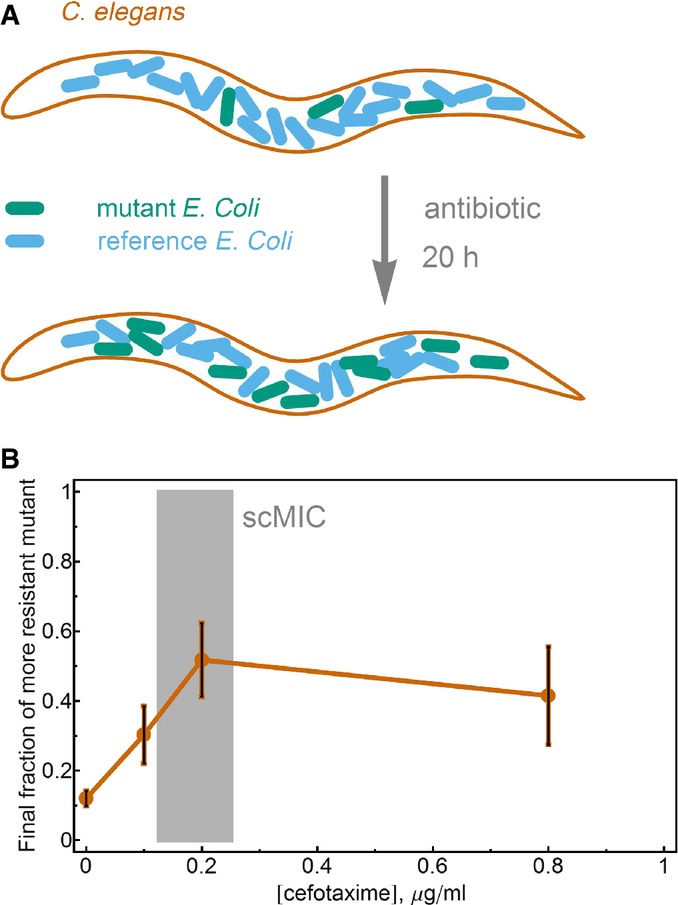
The scMIC predicts selection in an animal infection model
- Schematic representation of the in vivo experiment. C. elegans were colonized with a mixture of the reference strain (90%) and the more resistant mutant TEM-52 (10%) and were treated with antibiotic for 20 h before the final fraction of TEM-52 was measured.
- Selection for increased resistance begins at antibiotic concentrations near the scMIC, as in the in vitro measurements. The error bars are the standard error of the mean of three measurements. The discrepancy between the in vivo scMIC and the in vitro measurements is likely due to differences in respective environmental conditions, such as nutrient availability and temperature.
Source data are available online for this figure.