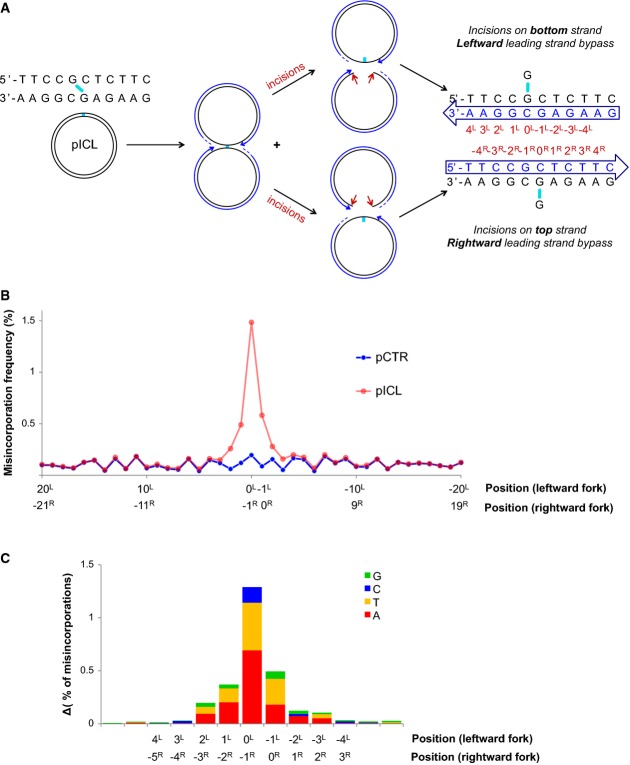
Figure 7.
Mutation spectrum generated during bypass of the unhooked ICL
- A schematic representation of fork convergence, incisions and lesion bypass using either of the parental strands as the template. For the nascent strand (blue arrow), the nucleotide positions relative to the position of the adduct in each parental strand are indicated (red numbers).
- pCTR and pICL replication products were recovered after 60 and 240 min, respectively. A 115-nt-long fragment surrounding the cross-link (present in pICL only) was deep-sequenced. A total of 1.7 million reads for pCTR and 2.6 million reads for pICL were obtained. For both plasmids, the misincorporation frequency in a 20-bp region surrounding the ICL is displayed. Nucleotide positions for the leftward and rightward forks are indicated, as in (A).
- Distribution of nucleotide misincorporations in (A). The height of each colored segment represents the frequency with which that nucleotide is incorporated minus the baseline frequency in pCTR. The total height of the bars represents the overall misincorporation frequency minus baseline. Nucleotide positions for the leftward and rightward forks are indicated, as in (A).

