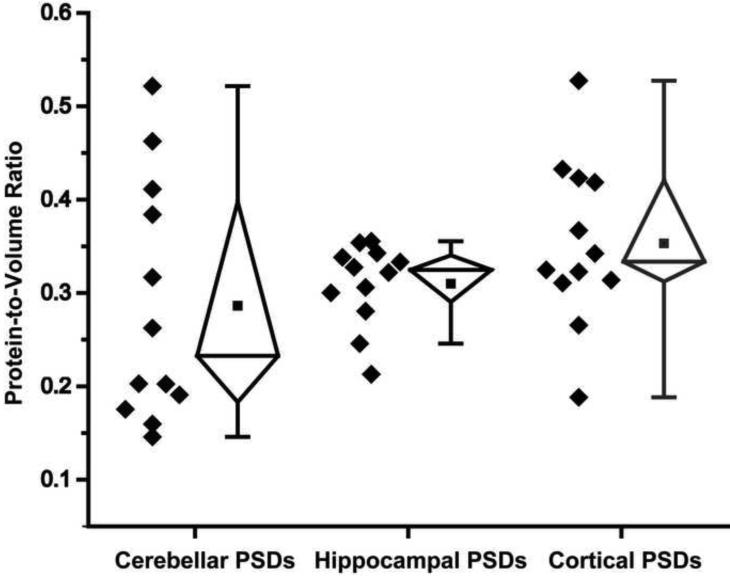
Figure 8.
Protein Occupancy of PSDs Isolated from Cerebella, Hippocampi and Cortices. Whisker plot showing individual and mean protein-to-volume ratios, defined as the total number of voxels containing protein divided by the total number of voxels contained within the PSD. Values from each of twelve cryo-preserved PSDs from each brain region are shown as black diamonds. Within the whisker plots, the black squares represent the mean, the line represents the median, the pyramids represent the interquartile range and the error bars show the 95% to 5% range of the data.

