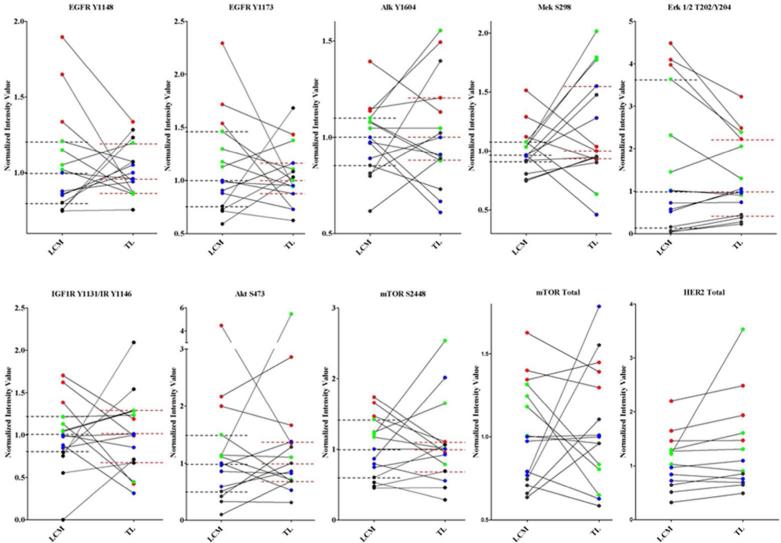
Figure 2.
Pairwise comparison between LCM and matched whole tissues (TL) samples for a number of important drug targets for NSCLC. Samples were first normalized to the median of the population of origin (LCM or TL) and subsequently color-coded based on their quartile distribution (black 1st quartile, blue 2nd quartile, green 3rd quartile and red 4th quartile) in the LCM sample, and then the same patients were ranked in the TL samples. Paired values were connected with solid lines to show the distribution of the matched LCM and TL. Black and blue dashed lines indicate the quartiles for the LCM and TL respectively.

