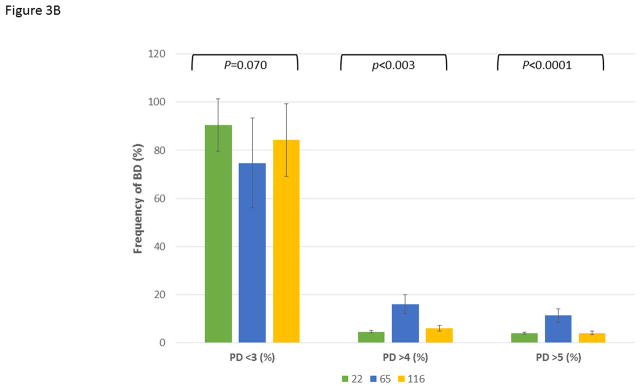
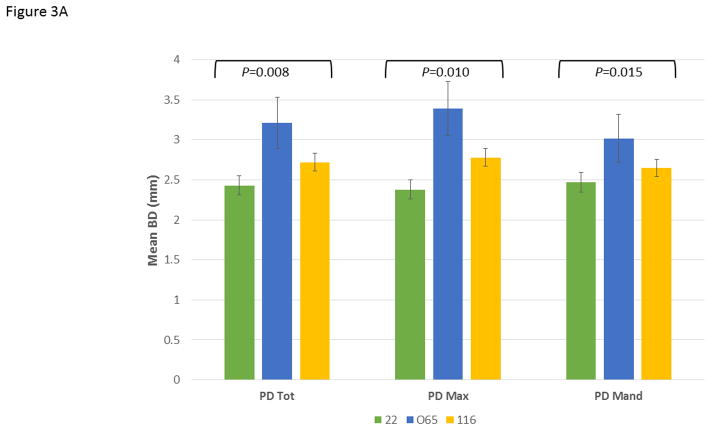
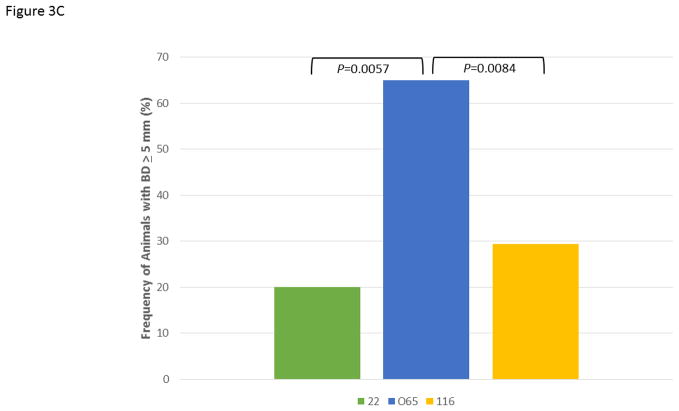
Figure 3.

Comparison of disease expression across all ages in each of the family units using ANOVA with Tukey HSD. The bars are group means and the vertical brackets enclose 1 SE. (A) Extent of disease described by mouth mean bone defects (BD Tot; F=5.12, df1, P=0.0077), as well as similar measures limited to the maxillary (BD Max; F=4.79, df1, P=0.0104) and mandibular (BD Mand; F=4.42, df1, P=0.0145) quadrants. (B) Severity of disease described by frequency of sites with bone defects less than (<)3 mm (F=2.73, df1, P=0.0701), greater than (>)4 mm (F=6.12, df1, P=0.0031) and 5 mm (F=12.34, df1, P<0.0001). (C) Frequency of animals across the age groups in each family unit demonstrating 1 or more bone defects greater than or equal to 5 mm using Chi-square analysis with Yates correction (22 vs. 065; χ2=7.641, df1, P=0.0057; 065 vs. 116; χ2=6.940, df1, P=0.0084).


