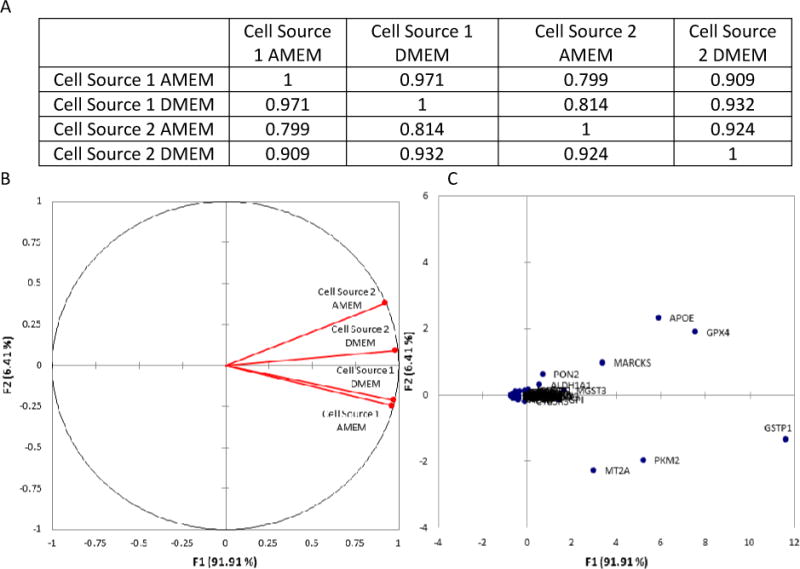
Figure 2.

Principal Component Analysis (PCA) results for the normalized Drug Metabolizing Enzyme (DME) mRNA expression levels at day 21 post-seeding. A) Illustrates the Pearson Correlation Matrix for each of the four test groups; B) Illustrates the correlations circle which is useful for interpreting the meaning of the factors used in the PCA; and C) Illustrates a scatter plot of the factor scores for each of the 84 metabolic genes studied.
