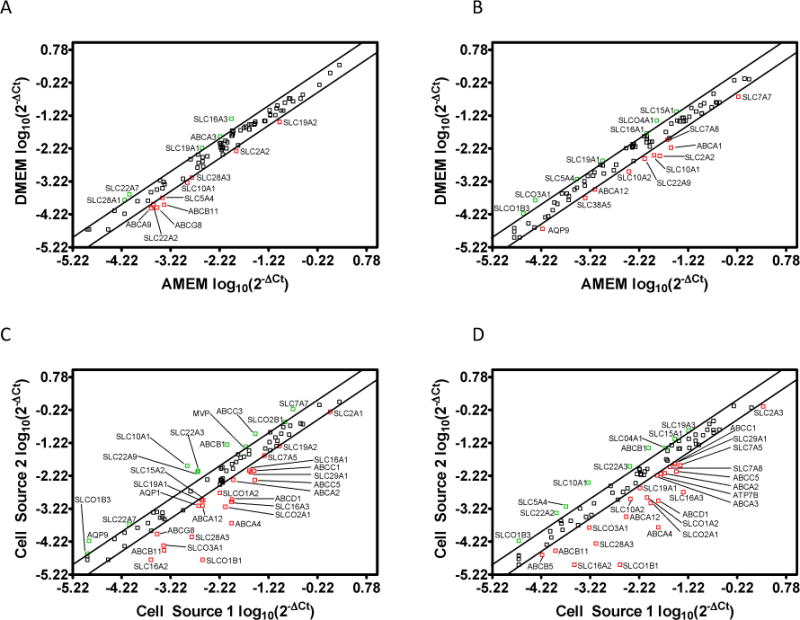
Figure 3.

Scatter plots illustrating the normalized drug transporter mRNA expression level (log10(2−ΔCt)) at day 21 post-seeding for A) Cell Source 1 cultured in Dulbecco’s Modified Eagle’s Medium (DMEM) vs. Minimum Essential Medium Alpha (AMEM); B) Cell Source 2 cultured in DMEM vs. AMEM; C) Cell Source 2 vs. Cell Source 1 cultured in AMEM; and D) Cell Source 2 vs. Cell Source 1 cultured in DMEM. The upper and lower diagonal lines indicate a two-fold up/down regulation, respectively.
