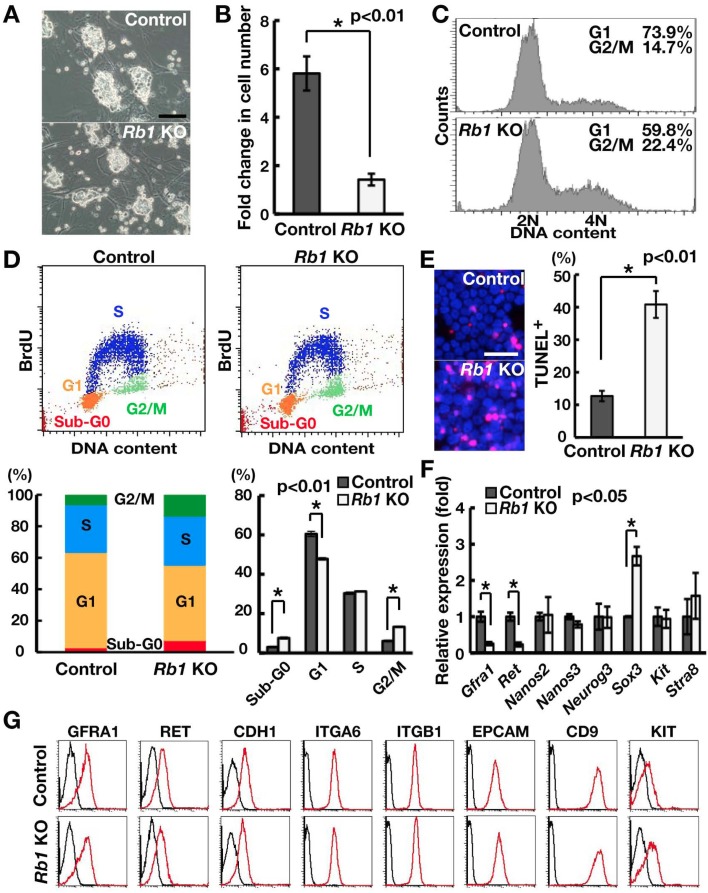
Fig. 3.
Increased apoptosis and abnormal cell cycle progression of Rb1 KO GS cells. (A) Appearance of Rb1 KO GS cells. (B) Impaired proliferation of Rb1 KO GS cells (n = 3). Cells were recovered 2 weeks after AxCANCre transfection. (C) Analysis of cell cycle distribution using Hoechst 33342. Cells were analyzed 2 weeks after AxCANCre transfection. (D) Quantification of cell cycle phases by combined propidium iodide and BrdU staining. Cells were analyzed 2 weeks after AxCANCre transfection (n = 3). (E) Quantification of apoptotic cells using TUNEL staining (n = 3). At least 273 cells were counted 1 week after AxCANCre transfection. (F) Real-time PCR analysis of spermatogonia markers (n = 6). (G) Flow cytometric analysis of cell surface markers. Bar = 50 μm (A, E).

