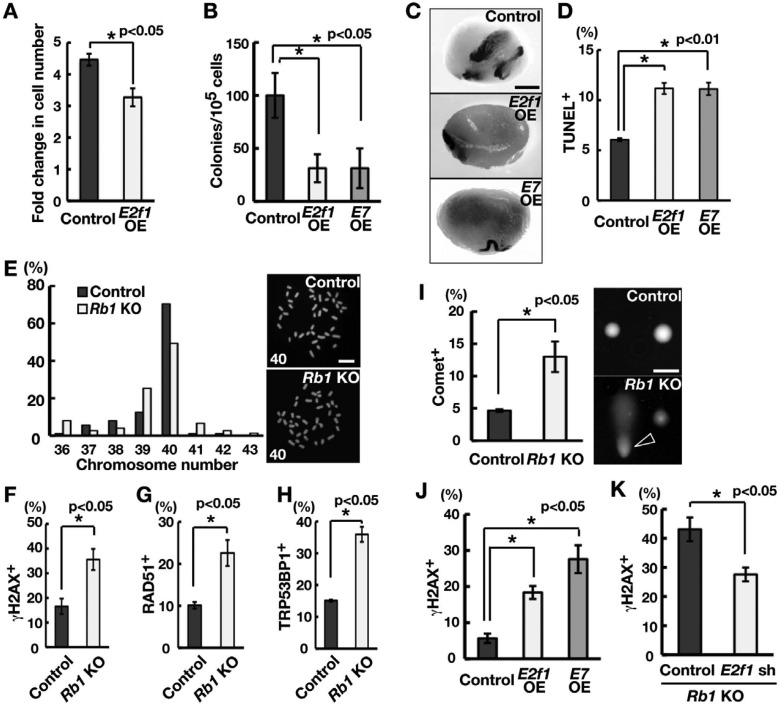
Fig. 4.
Induction of DNA DSBs by E2F1 activation. (A) Suppression of GS cell proliferation following transfection of E2f1. GS cells were infected with the indicated lentivirus and passaged 4 days after transfection. Cell recovery was determined 6 days after passage (n = 3; MOI = 10). (B) Colony counts. Results of two experiments (n = 8). (C) Macroscopic appearance of recipient testis. (D) Quantification of apoptotic cells following E2f1 or E7 OE using TUNEL staining. At least 536 cells were counted 10 days after AxCANCre transfection. Results of four experiments (MOI = 10). (E) Karyotype analysis and metaphase spread of GS cells. Cells were analyzed 2 weeks after AxCANCre transfection (n = 88 for control; n = 75 for KO). The number in the metaphase spread indicates the chromosome number. (F–H) Quantification of γH2AX- (F), RAD51- (G) and TRP53BP1 (H)-positive cells of Rb1 KO GS cells. Cells were recovered 2 weeks after AxCANCre transfection (n =3). At least 338 (F), 401 (G) and 149 (H) cells were counted. Representative pictures are shown in Supplementary Fig. 2 (online only). (I) Comet assay. Data are expressed as the percent damage compared with the control sample. The arrowhead indicates a cell with DNA damage. (J) Immunocytochemistry of GS cells transfected with E2f1 or E7 for γH2AX. Cells were recovered 10 days after transfection (n = 3). At least 304 cells were counted. (K) Suppression of γH2AX staining following depletion of E2f1. Cells were co-transfected with AxCANCre and a lentivirus expressing shRNA against E2f1 and recovered 6 days after transfection (n = 3; MOI = 4). At least 252 cells were counted. Bar = 1 mm (C), 50 μm (E, I).

