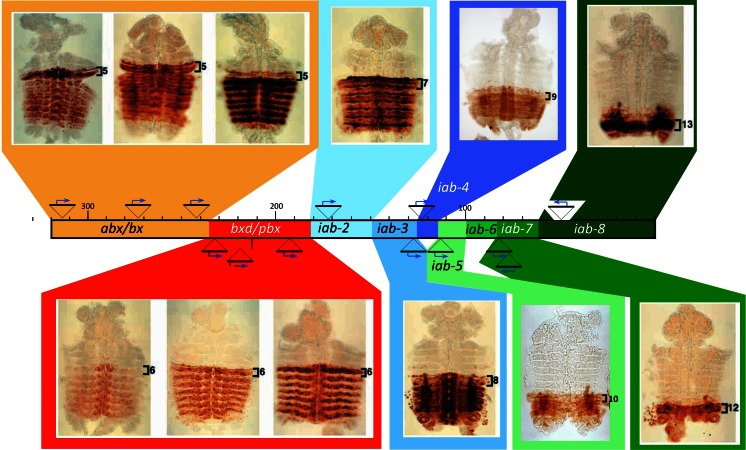
Fig. 5.
Painting the regulatory domains with enhancer trap lines. Reproduced from Fig. 5 of Maeda and Karch (2006); DOI: 10.1242/dev.02323 with the permission of the Company of Biologists. The 300-kb-long genomic DNA of the bithorax are represented as a long rectangle in the middle of the figures, with the insertion sites of the various enhancer trap P[lacZ] transposons indicated by triangles above it. Embryos stained with antibodies directed against ß-galactosidase are shown above and below the DNA lines. They were cut along the dorsal midlines and flattened on a microscope slide. The anterior parasegmental boundary of lacZ expression is indicated in each embryo. Note that this anterior border of expression moves by increment of 1 parasegment when the insertion site of the P[lacZ] transposon moves from left to right on the DNA map. The extent of each regulatory domain was determined by integrating the insertion sites of the P[lacZ] transposons with the locations of various rearrangement breakpoints associated with iab mutations and with the locations of the Mcp, Fab-7, Fab-8 mutations

