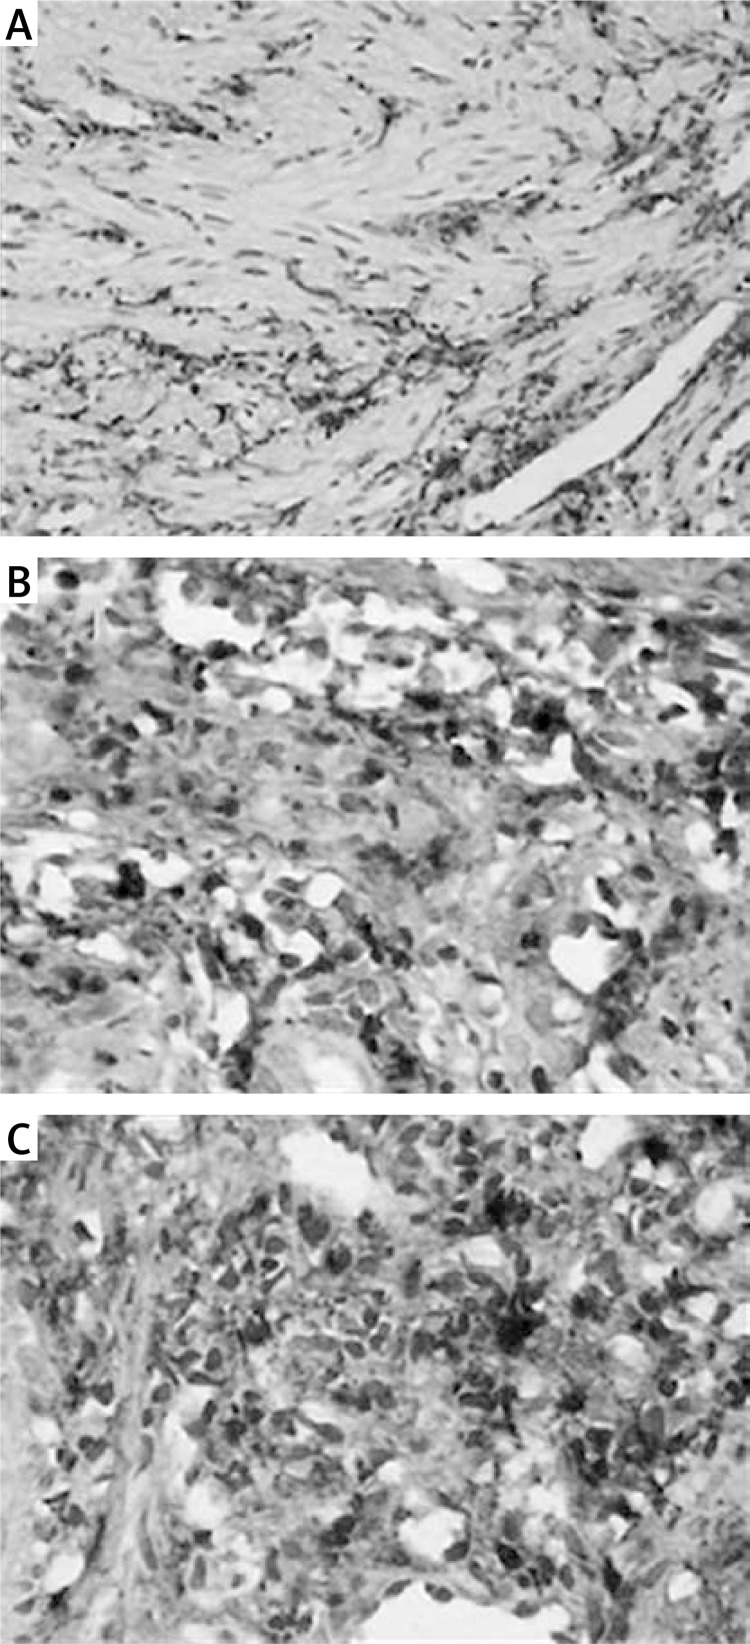
Figure 4.
Levels of CTGF protein in the anastomotic tissues. Levels of CTGF protein in tissue samples were determined by SABC IHC (original magnification 200×). Low expression of CTGF protein was observed in the cytoplasm of fibroblasts in the control group, while, in the AS group, significant increases (p < 0.05) in levels of CTGF protein were observed in the cytoplasm of fibroblasts, and the fibroblasts were disorganized, showing loss of polarity and strong staining. Compared with the control group, significant increases in the CTGF protein expression were observed in the AS group. The CTGF protein levels increased significantly (p < 0.01) with the increasing severity of AS. The positive expression of CTGF protein in the AS group was indicated by the brown-yellow granules. A – Control group; B – mild stenosis group; C – severe stenosis group

