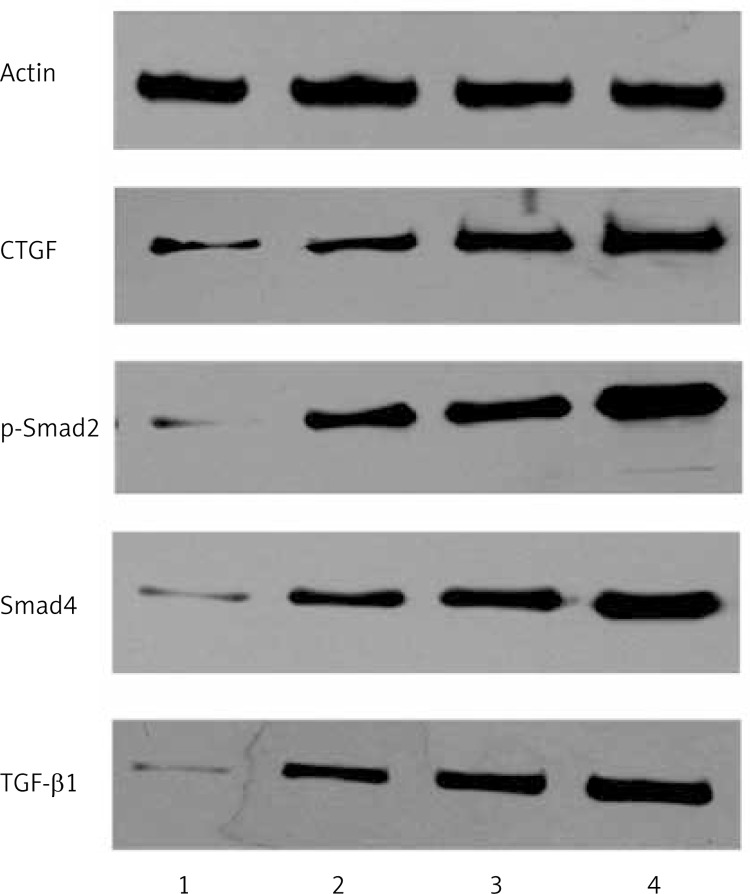
Figure 7.
Levels of CTGF, TGF-β1, p-Smad-2, and Smad4 protein were evaluated by western blotting analysis. Compared with the control group, levels of CTGF, TGF-β1, p-Smad-2, and Smad4 protein were up-regulated. The protein levels of TGF-β1 and CTGF increased with the severity of strictures in different groups. 1 – Control group; 2 – mild stenosis group; 3 – moderate stenosis group; 4 – severe stenosis group

