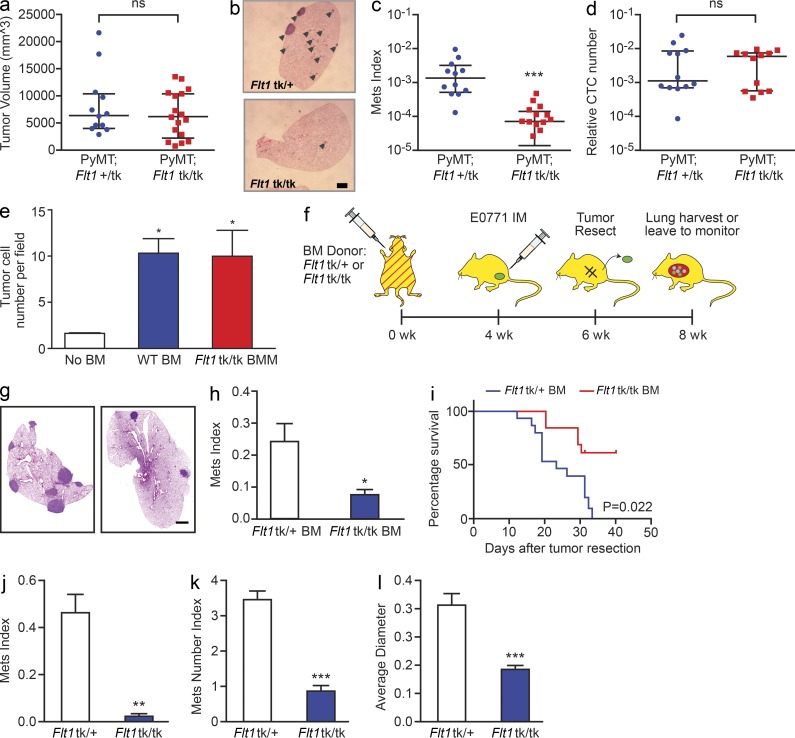
Figure 1.
Stromal FLT1 is important for breast cancer pulmonary metastasis. (a) Total tumor burden of PyMT; Flt1tk/+ or PyMT; Flt1tk/tk mice at 19 wk of age. (b) Representative H&E-stained section of lung metastasis nodules of PyMT; Flt1tk/+ (top) or PyMT; Flt1tk/tk mice (bottom; arrowheads). (c) Stereological quantification of lung metastasis index at 19 wk of age. Mets index is equal to total metastasis volume normalized by total lung volume. Bars show median with interquartile range; n ≥ 12; ***, P < 0.001 by Mann-Whitney test. (d) Quantification of circulating tumor cell number by relative PyMT gene expression in CD45-circulating cells in age-matched littermate mice bearing late stage tumors. Bars represent median ± interquartile range; n = 12; not significant by Mann-Whitney test. (e) BMMs induce Met-1 cell invasion in a modified transwell invasion assay, whereas Flt1tk/tk macrophages show no difference compared with WT macrophages. Error bars indicate SEM. n = 3 with duplicate; *, P < 0.05; not significant between WT and Flt1tk/tk BMM by one-way ANOVA with Tukey’s multiple comparison. (f) Spontaneous metastasis of E0771 cells in littermate heterozygous or homozygous for Flt1tk targeted mutation. (g) Representative automatically stitched scanned images of H&E-stained lung cross section. (b and g) Bars, 1 mm. (h) Stereological quantification of mice harvested at 8 wk. Metastasis quantification was the same as in c. Mean + SEM; n = 9; *, P < 0.05 by Mann-Whitney test. (i) Survival curve of mice left to monitor. Death is defined as time the mice became moribund; n ≥ 13; P = 0.022 by log-rank test. (j–l) Stereological quantification of the distal metastasis efficiency of Met-1 cells in mice heterozygous or homozygous for Flt1tk targeted mutation. Mets index (j) was the same as in c; metastasis number index (k) is equal to averaged number of metastasis sites per square millimeter lung area; average diameter (l) is the averaged size of metastasis nodules in millimeters. Bars represent mean ± SEM. n ≥ 8; **, P < 0.01; ***, P < 0.001 by Student’s t test.

