Figure 4.
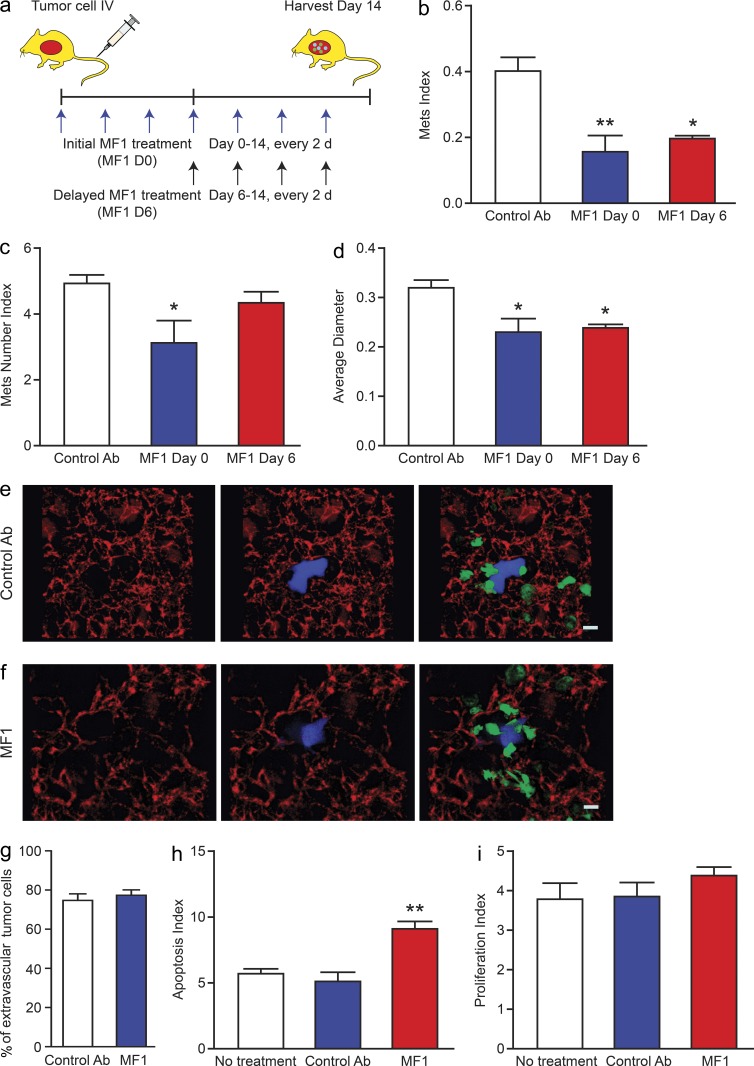
FLT1 inhibition blocks breast cancer metastatic growth. (a) Schematic of experimental metastasis assay of Met-1 cells in syngeneic FVB mice with control antibody and FLT1 inhibitory antibody (MF1) treatment started at the indicated time related to tumor cell inoculation. (b–d) Stereological quantification of the distal metastasis efficiency of Met-1 cells with control and MF1 treatment. Metastasis quantification was the same as in Fig. 1. Mean + SEM. n ≥ 5; *, P < 0.05; **, P < 0.01 by ANOVA plus Dunnett’s multiple comparison test. (e and f) Representative snapshots of 3D reconstructed confocal images of tumor cell (CFP, shown in blue) and macrophage (GFP, shown in green) 24 h after tumor cell tail vein injection in mice treated with control antibody (e) and MF1 (f). Bars, 200 µm. (g) Quantification of percentage of tumor cells that have extravasated 24 h after tail vein injection. Error bars indicate SEM. n = 3; not significant by Student’s t test. (h) Apoptosis index, defined by percentage of TUNEL-positive tumor cells, in Met-1 cell lung metastasis with 2-d antibody treatment. Data show mean + SEM. n ≥ 3; **, P < 0.01 by ANOVA plus Dunnett’s multiple comparison test. (i) Proliferation index defined by percentage of Ki67-positive cells in total tumor cells. Data are shown as mean + SEM. n = 4; not significant by one-way ANOVA.

