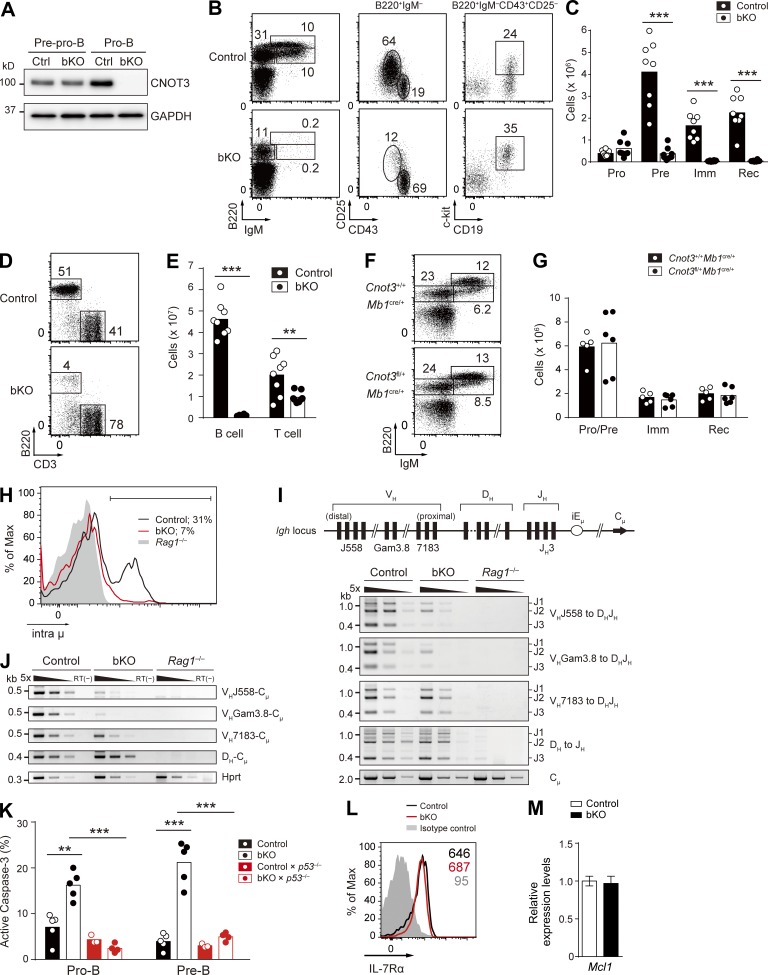
Figure 2.
CNOT3 is essential for early B cell development. (A) CNOT3 protein expression in sorted pre-pro–B (Lin−B220+IgM−CD43+CD25−CD19−) and pro–B (Lin−B220+IgM−CD43+CD25−CD19+) cells in the bone marrow from control and bKO mice was analyzed by Western blotting. GAPDH, loading control. (B and C) Flow cytometry (B) and absolute number of B cell subsets (C) of the bone marrow cells from control (n = 8) and bKO (n = 8) mice; B220+IgM−CD43+CD25−CD19+c-kit+ pro–B (Pro), B220+IgM−CD43−CD25+ pre–B (Pre), B220intIgM+ immature B (Imm), and B220hiIgM+ recirculating B (Rec) cells. (D and E) Flow cytometry (D) and absolute number (E) of splenic B cells (B220+CD3−) and T cells (B220−CD3+) from control (n = 8) and bKO (n = 8) mice. (F and G) Flow cytometry (F) and absolute number of B cell subsets (G) of bone marrow from Cnot3+/+Mb1cre/+ (n = 5) and Cnot3fl/+Mb1cre/+ (n = 6) mice; B220+IgM− pro–B and pre-B (Pro/Pre), B220intIgM+ immature B, and B220hiIgM+ recirculating B cells. Numbers in B, D, and F indicate the percentage of cells. (H) Flow cytometry of intracellular Ig μ chain (intra μ) expression in pro–B cells from control, bKO, and Rag1−/− mice. Percentages indicate the frequency of intra μ–positive cells (bracketed line). (I, top) Schematic drawing of the germline Igh locus with the relative location of the different VH family members. (bottom) PCR analysis of DH-JH and VH-DHJH rearrangements with fivefold serial dilutions of genomic DNA from sorted pro–B cells of control, bKO, and Rag1−/− mice. Cμ, loading control. (J) RT-PCR analysis of the expression of the rearranged DH-Cμ and VH-Cμ transcripts with fivefold serial dilutions of cDNA prepared from sorted pro–B cells of control, bKO, and Rag1−/− mice. Hprt, loading control; RT(−), no reverse transcription. (K) Frequency of apoptotic pro- and pre–B cells from mice of the indicated genotypes (n = 3–5), as assessed by positive staining of active caspase-3. (L) Flow cytometry analysis of surface expression of IL-7Rα on pro–B cells from control and bKO mice. Gray histogram, isotype control signal in control mice. Numbers indicate the mean fluorescence intensity of each population. (M) Relative mRNA expression levels of Mcl1 in bKO pro–B cells compared with control pro–B cells, as determined by real-time qPCR. Error bar represents SD. n = 3 biological replicates. (C, E, G, and K) Each symbol represents a single mouse, and bars indicate the mean. (A–M) Data are representative of three (A, B, D, F, H, I, and J) or two (L and M) independent experiments or are pooled from three (C and E) or two (G and K) experiments. **, P < 0.01; ***, P < 0.001; Student’s t test.

