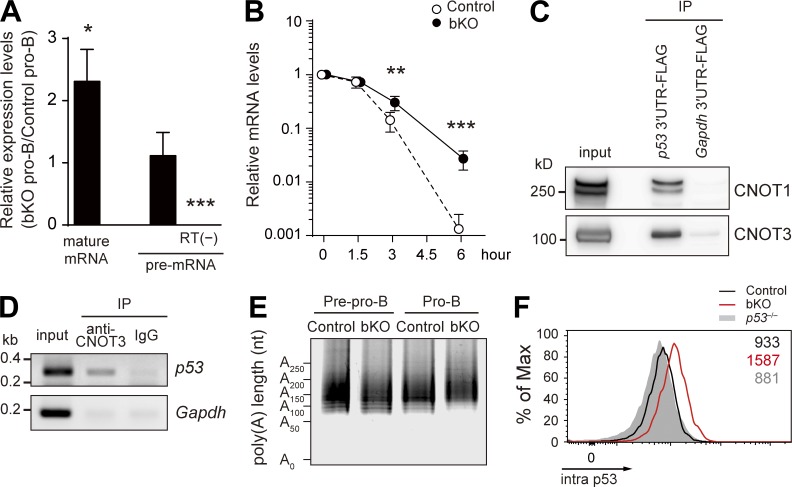
Figure 4.
CNOT3-mediated posttranscriptional regulation of p53 mRNA. (A) Relative expression levels of spliced p53 mature mRNA and unspliced pre-mRNA in bKO pro–B cells compared with control pro–B cells, as determined by real-time qPCR. Error bars represent SD. n = 4 biological replicates. RT(−), no reverse transcription. (B) Stability of p53 mature mRNA. Pro–B cells from control and bKO mice were treated with actinomycin D for the indicated periods of time, and the relative mRNA levels compared with time 0 were determined by real-time qPCR. Data are shown as mean ± SD of n = 3 biological replicates. (C) Association of CNOT1 and CNOT3 with the 3′-UTR of p53 mRNA. FLAG-tagged 3′-UTRs of p53 and Gapdh mRNA were incubated with lysates of an Abelson virus–transformed pro–B cell line and immunoprecipitated with anti-FLAG antibody, followed by Western blotting. (D) Association of CNOT3 with p53 mRNA by RIP assay. Wild-type pro–B cell lysates were immunoprecipitated with anti-CNOT3 antibody or control IgG, and the immunoprecipitates were analyzed by RT-PCR with primers specific to p53 and Gapdh mRNA. (E) Poly(A) tail length of p53 mRNA in pre-pro–B and pro–B cells of control and bKO mice was determined by the LM-PAT assay. (F) Flow cytometry of intracellular p53 protein expression in pro–B cells from control, bKO, and p53−/− mice. Numbers indicate the mean fluorescence intensity of each population. Data are representative of three independent experiments. *, P < 0.05; **, P < 0.01; ***, P < 0.001; Student’s t test.

