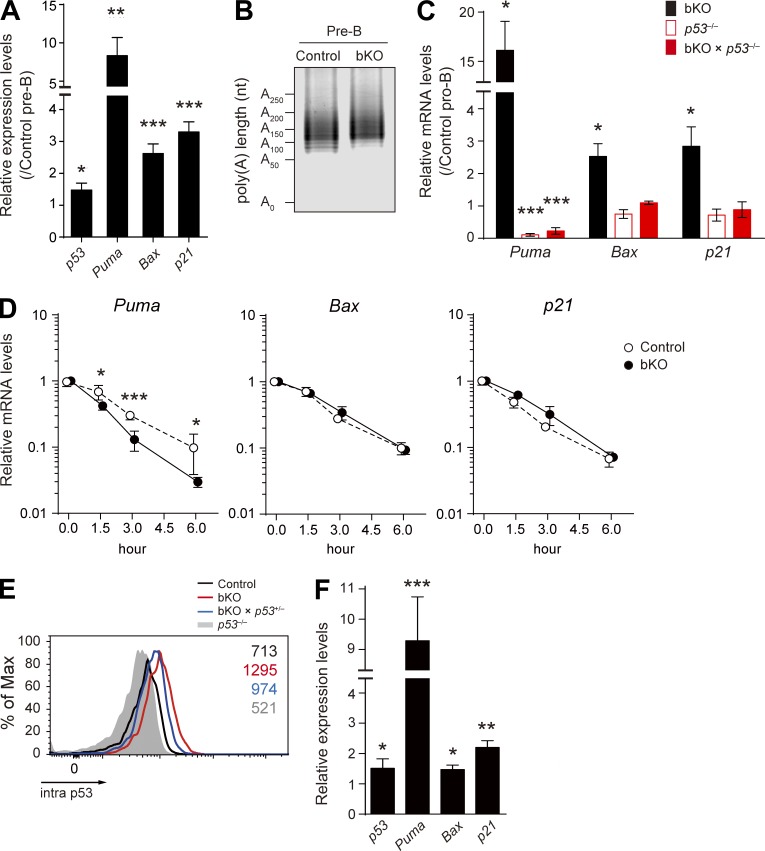
Figure 5.
Analysis of p53 pathway genes in pro-B and pre–B cells. (A) Real-time qPCR analysis of the relative mRNA expression levels of p53, Puma, Bax, and p21 in pre–B cells of bKO mice, normalized by control pre–B cells. (B) Poly(A) tail length of p53 mRNA in pre–B cells of control and bKO mice was determined by the LM-PAT assay. (C) Real-time qPCR to analyze the relative mRNA expression levels of Puma, Bax, and p21 in pro–B cells from the indicated mice compared with those in control pro–B cells. (D) Stability of Puma, Bax, and p21 mRNAs was analyzed by real-time qPCR as described in Fig. 4 B. Data are shown as mean ± SD of n = 3 biological replicates. (E) Flow cytometry of intracellular p53 protein expression in pro–B cells from control, bKO, bKO × p53+/−, and p53−/− mice. Numbers indicate the mean fluorescence intensity of each population. (F) Real-time qPCR to analyze the relative mRNA expression levels of p53, Puma, Bax, and p21 in pro–B cells from bKO × p53+/− mice compared with control pro–B cells. (A, C, and F) Error bars represent SD. n = 3 biological replicates. Data are representative of two independent experiments. *, P < 0.05; **, P < 0.01; ***, P < 0.001; Student’s t test.

