Figure 6.
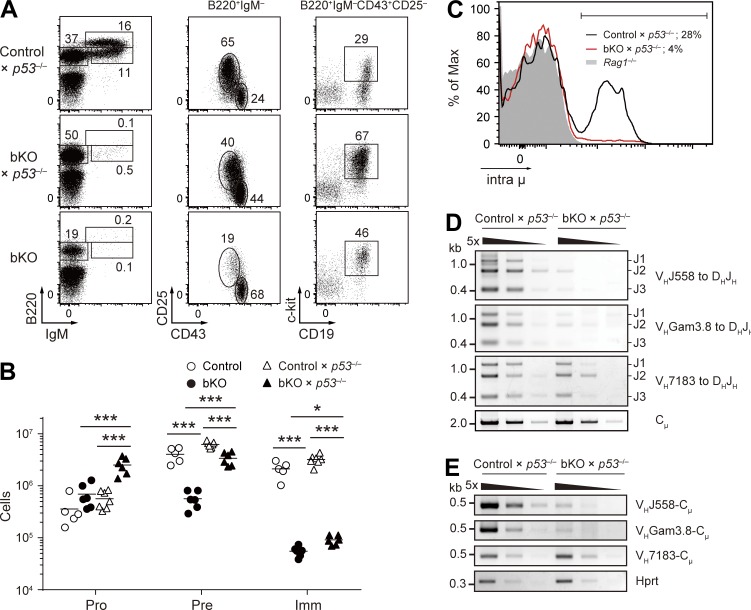
Analysis of Cnot3 and p53 double-deficient mice. (A and B) Flow cytometry (A) and absolute number of B cell subsets (B) in the bone marrow cells from the indicated mice (n = 5–7) using the same gating strategy as in Fig. 2 (B and C). (B) Each symbol represents a single mouse, and bars indicate the mean. *, P < 0.05; ***, P < 0.001; Student’s t test. (C) Flow cytometry of intra μ expression in pro–B cells from control × p53−/−, bKO × p53−/−, and Rag1−/− mice. Percentages indicate the frequency of intra μ–positive cells (bracketed line). (D) PCR analysis of VH-DHJH rearrangements with fivefold serial dilutions of genomic DNA from sorted pro–B cells of control × p53−/− and bKO × p53−/− mice. (E) RT-PCR analysis of the expression of the rearranged VH-Cμ transcripts with fivefold serial dilutions of cDNA prepared from sorted pro–B cells of control × p53−/− and bKO × p53−/− mice. (A–E) Data are representative of three independent experiments (A and C–E) or are pooled from three experiments (B).

