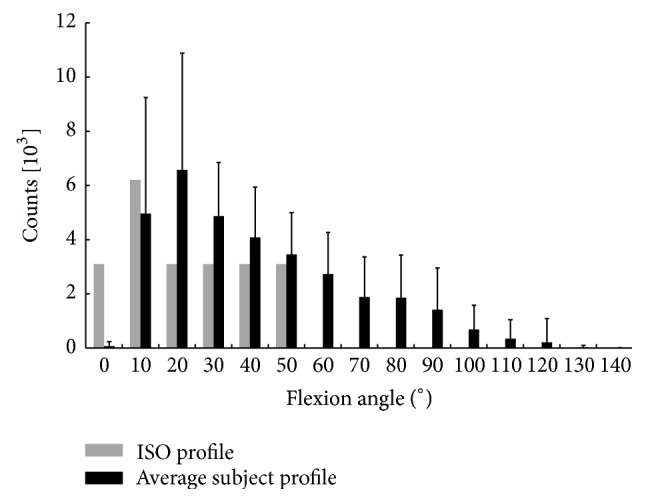
Figure 4.

Mean (1 SD) number of level crossings for flexion angle levels from 0 to 140°. Standard deviations are indicated for the average counts of the activity analysis patient population. The ISO profile count was extrapolated from the flexion-extension curve as provided by ISO 14243 (ISO-14243-1, 2002) and the average number of walking steps taken by the subjects during a 12-hour period.
