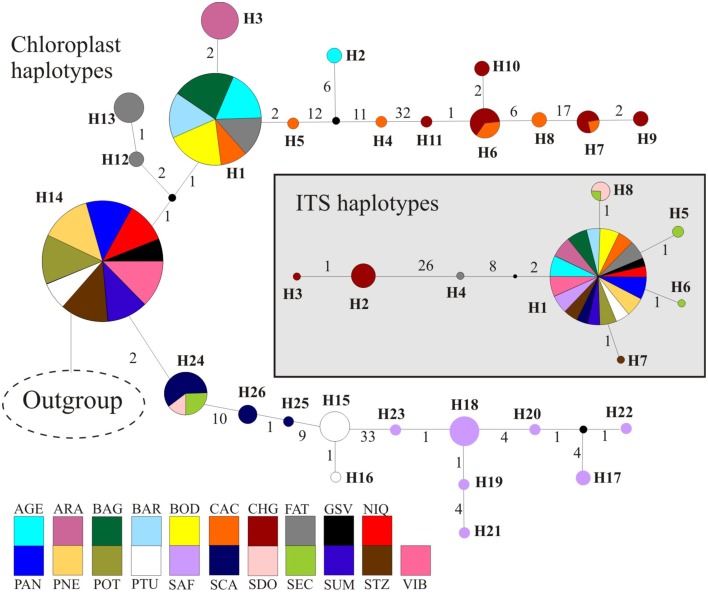
Figure 3.
Phylogenetic relationships among haplotypes using median-joining network. Circumference size is proportional to the haplotype frequency. Number of mutations is shown along lines in the network; small black circles are the median vectors. Different colors were assigned for each population according to the figure legend.

