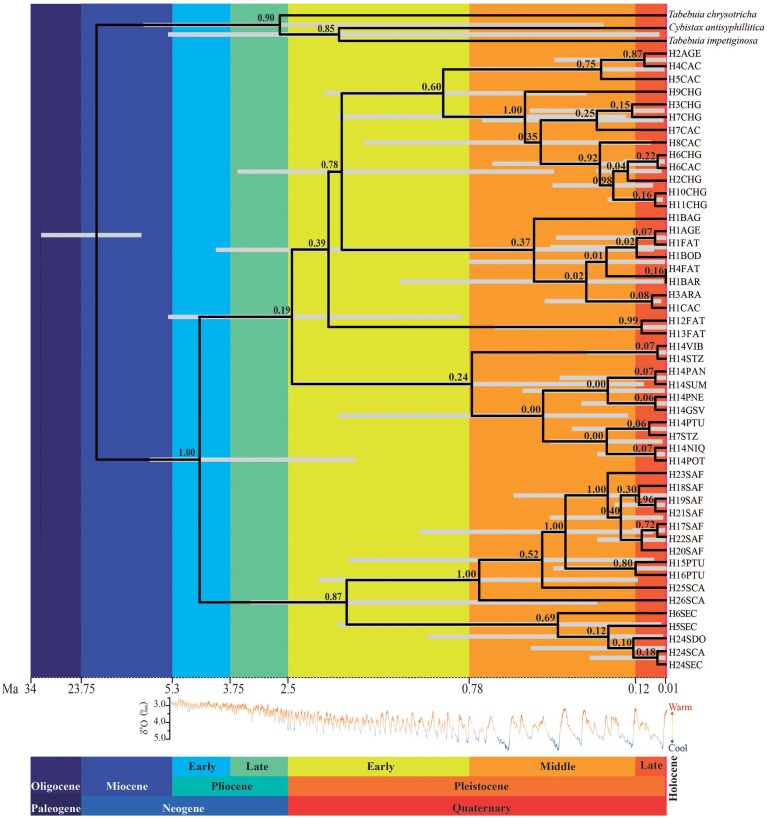
Figure 4.
Relationships and TMRCA of Tabebuia aurea lineages. The light gray bar corresponds to 95% highest posterior probability of the median time to the common ancestor; the numbers above the branches are the supports to the nodes (posterior probability). The time scale is in millions of years ago (Ma). The δ18O curve corresponds to the composite benthic stable oxygen isotope ratios (Lisiecki and Raymo, 2005).

