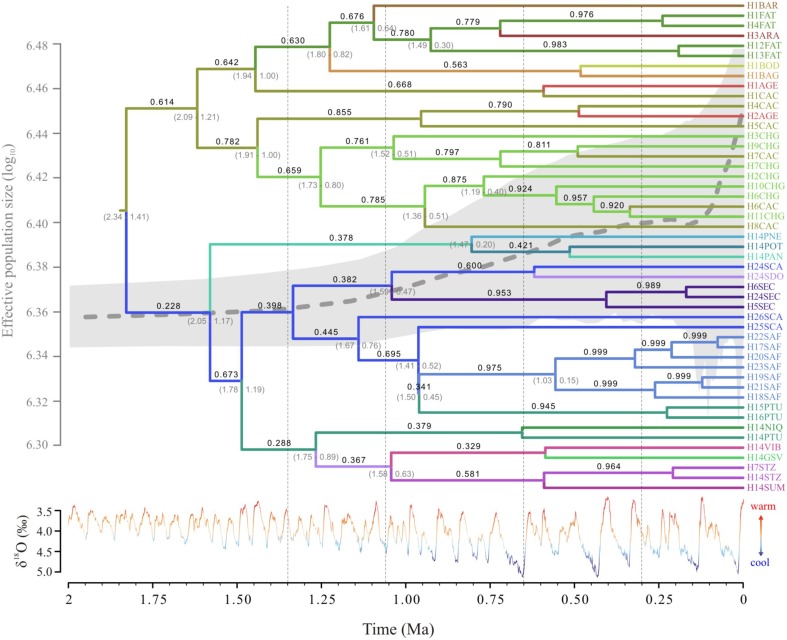
Figure 5.
Temporal dynamics of lineage diffusion showing the most probable locations for Tabebuia aurea lineages; branch color corresponds to the locality shown in the tip names; numbers above the branches are the location state posterior probability and below the branches are time 95% credibility intervals; the Extended Bayesian Skyline Plot is shown with the tree. The δ18O curve corresponds to the composite benthic stable oxygen isotope ratios (Lisiecki and Raymo, 2005). For details on population codes and localities see Table S1 in Appendix S1 and Figure 1.

