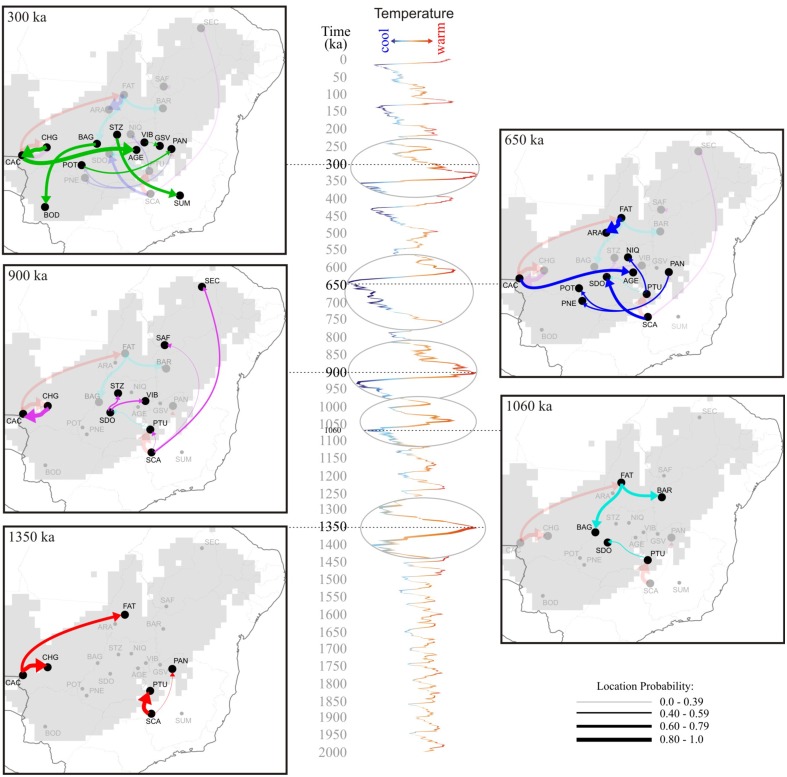
Figure 6.
Spatio-temporal dynamics of Tabebuia aurea lineage diffusion among the 21 populations sampled in Brazil, for 1.350 Ma, 900 ka, 650 ka, and 300 ka until present day. Arrows between locations represent branches in the tree along which the relevant location transition occurs. The map was adapted from the .kml file provided by SPREAD software generated using Google Earth (http://earth.google.com). The δ18O curve corresponds to the composite benthic stable oxygen isotope ratios (Lisiecki and Raymo, 2005). For details on population codes and localities see Table S1 in Appendix S1 and Figure 1.

