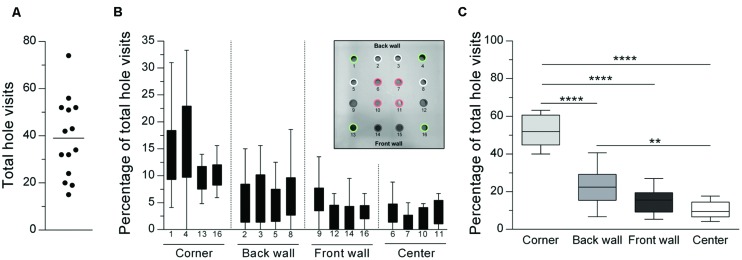
FIGURE 1.
General distribution of hole visits (median) during a hole-board test showing a clear preference for corner holes. (A) Total numbers of hole visits for individual animals (n = 14) are displayed as a scatter dot plot with the horizontal line describing the mean. Number of hole visits (% of total) are depicted for (B) all 16 holes and (C) summed up for each hole category. ∗∗p < 0.01; ∗∗∗∗p < 0.0001 comparisons as indicated (Holm-Sidak’s multiple comparison test after significant main effects in an ANOVA).

