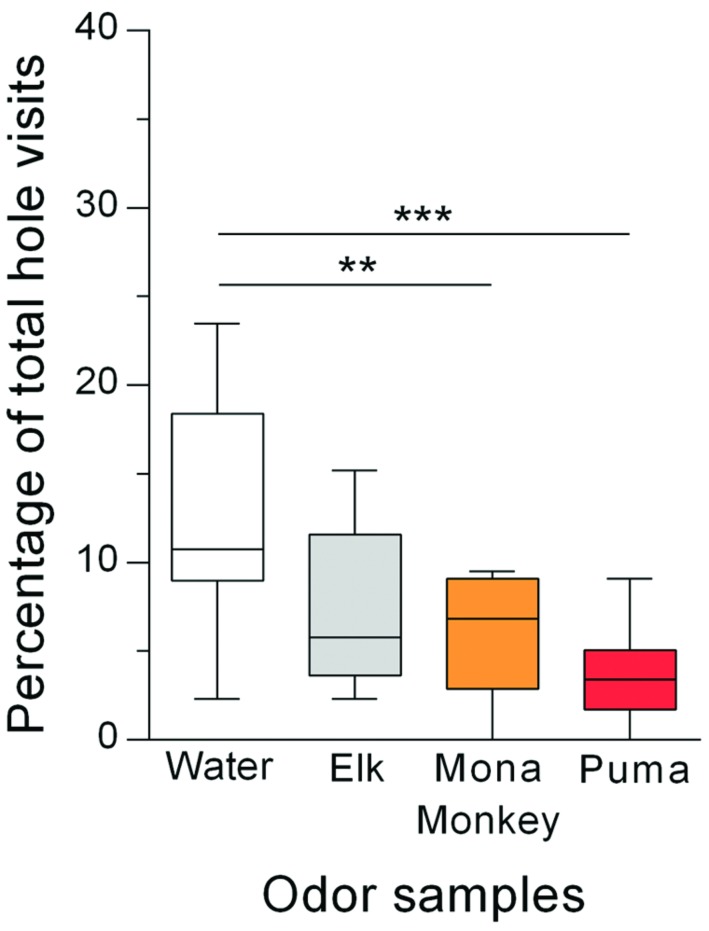
FIGURE 3.
Rats (n = 22) avoided holes with omnivore and carnivore urine but not holes with herbivore urine. Percentages of total hole visits (median) for the different corner holes are shown. ∗∗p < 0.01; ∗∗∗p < 0.001 comparisons as indicated (Dunn’s multiple comparison test after significant main effects in the Friedman test).

