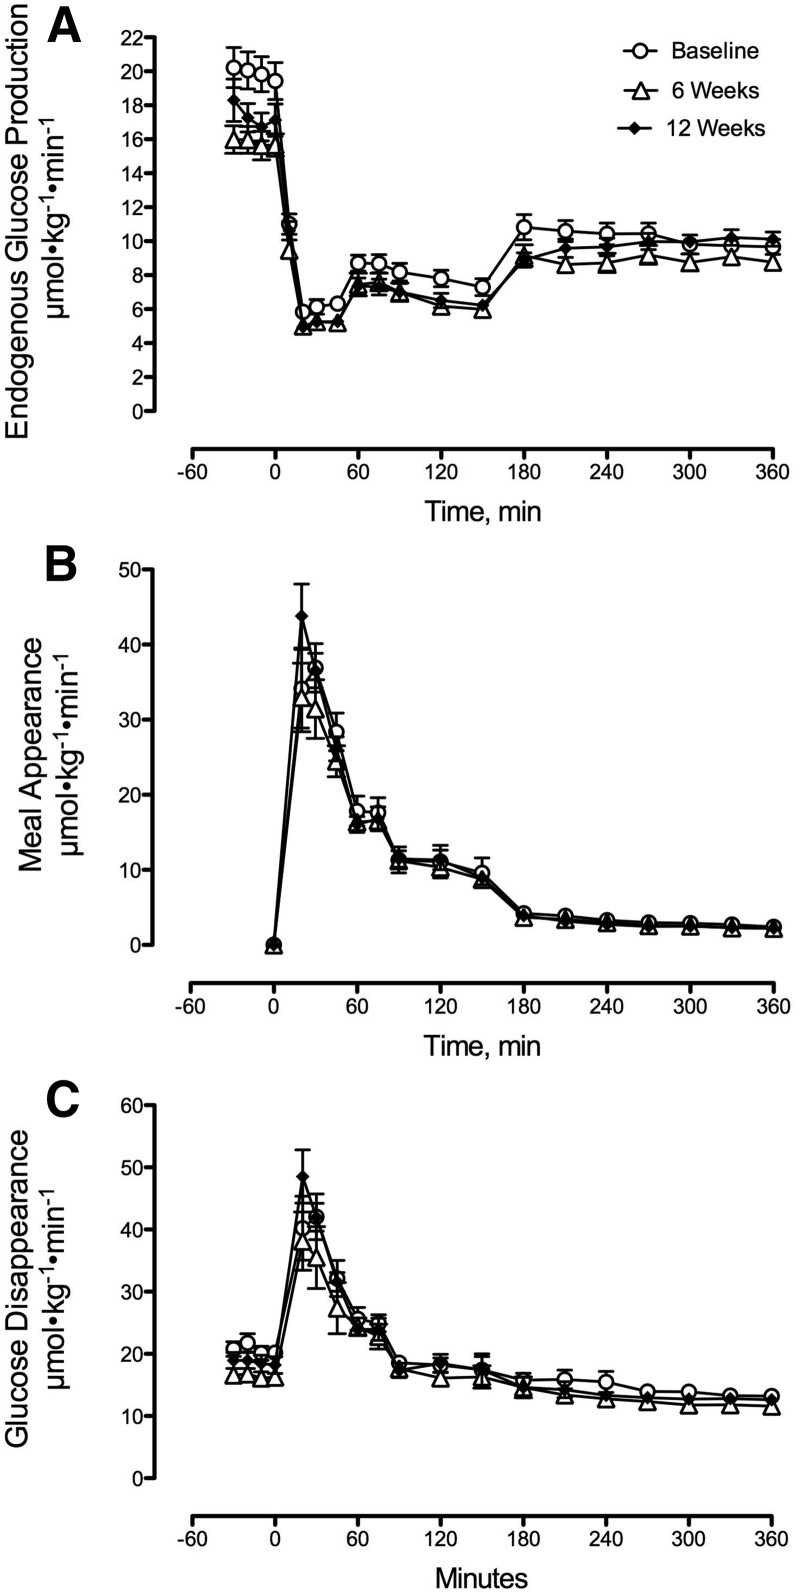
FIGURE 2.
Rates of endogenous glucose production (A), meal appearance (B), and glucose disappearance (C) during meal studies at baseline and after 6 or 12 wk of caloric restriction for patients with type 2 diabetes. The changes in fasting endogenous glucose production after 6 and 12 wk of caloric restriction are detailed in Table 3. Values are means ± SEMs, n = 9 except at 12 wk, n = 8.

