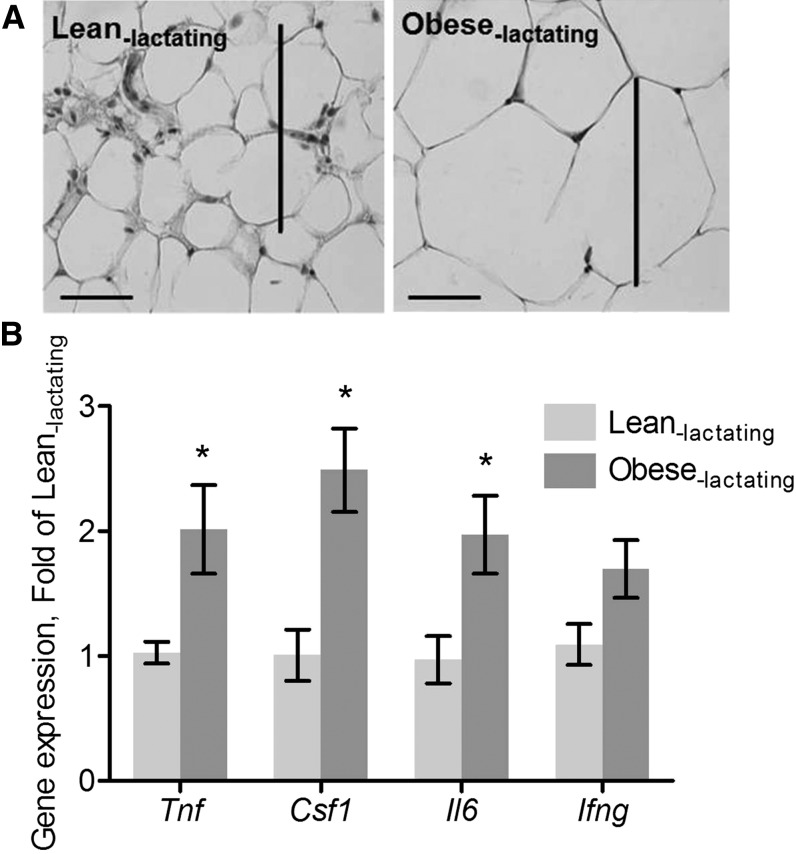
FIGURE 1.
Adipocyte size and cytokine mRNA expression in MGs from lean lactating and obese lactating mice. (A) Representative images of H&E-stained sections. Adipocyte size is shown (scale bars = 100 μm). (B) Cytokine mRNA expression. Data are means ± SDs, n = 8 (lean lactating) or n = 7 (obese lactating). *Different from lean lactating mice, P < 0.05. Csf1, colony-stimulating factor; H&E, hematoxylin and eosin; Ifng, interferon-γ MG, mammary gland; Tnf, tumor necrosis factor-α.

