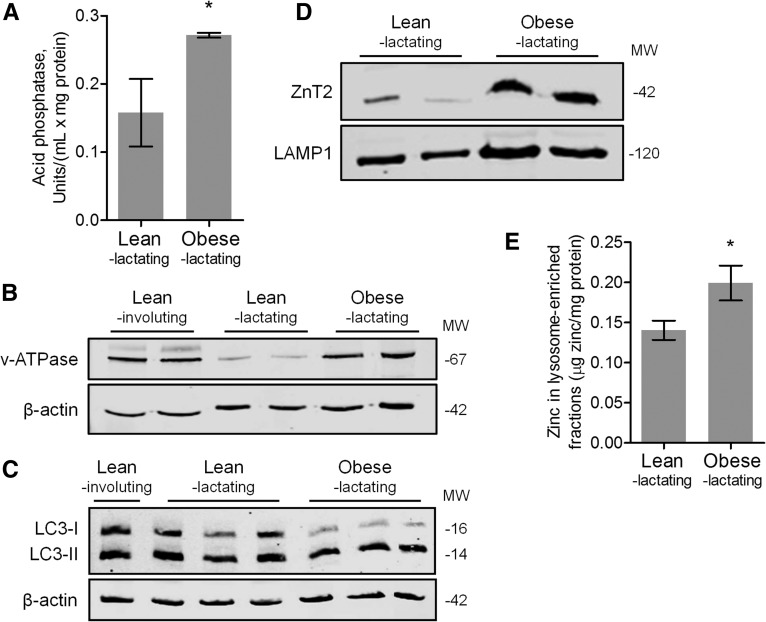
FIGURE 4.
Markers of lysosomal activity/autophagy and zinc metabolism in MGs from lean lactating and obese lactating mice. (A) Data are means ± SDs, n = 5 mice/group. *P < 0.05. Representative immunoblots of protein abundance of (B) v-ATPase and (C) LC3-I and LC3-II in MGs from lean lactating and obese lactating mice. Involuting MGs from lean mice are shown for comparison. (D) Representative immunoblots of ZnT2 and LAMP1 (lysosomal marker) and (E) zinc concentration in lysosome-enriched fractions isolated from MGs from lean lactating and obese lactating mice. Zinc concentration data are means ± SDs, n = 5 mice/group. *P = 0.05. LAMP1, lysosome-associated membrane protein 1; LC3, microtubule-associated protein light chain 3; MG, mammary gland; MW, molecular weight; v-ATPase, vacuolar-type H+-ATPase; ZnT2, zinc transporter 2.

