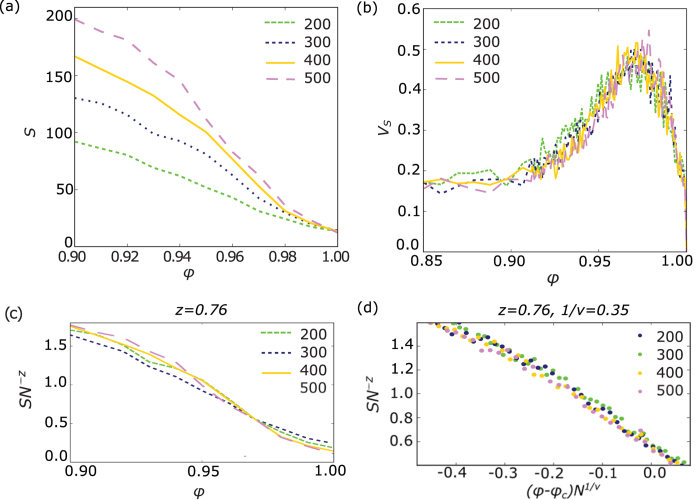
Figure 4.
Plot of (a) order parameter S, (b) coefficient of variation VS and (c) S scaled with N−z over control parameter ϕ for different agent numbers N. (d) Data collapse close to the critical point ϕc. S scaled with N−z over (ϕ − ϕc) scaled with Nν. All variables are averaged over 100 model runs.

