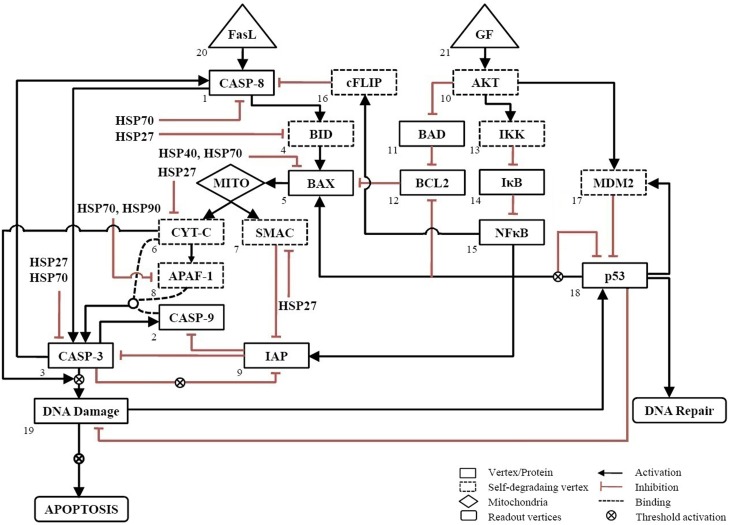
Figure 1.
Neuronal apoptosis network. The directed network consists of 21 vertices representing proteins and 37 edges describing the regulatory interactions between vertices. The regulatory interactions are shown, wherein activation is represented by → and inhibition by ˧. Self-degrading vertices are shown in dashed-line rectangular box. The input vertices represent survival factor, GF and death ligand, FasL shown in triangular box. The output of network was measured from readout vertices which represent DNA Repair and APOPTOSIS. The activation of Mito box denotes the initiation of mitochondrial death pathway.

