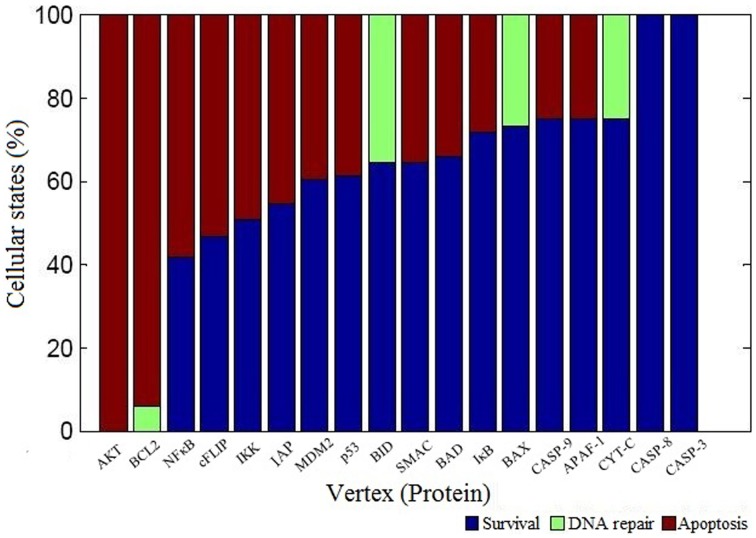
Figure 5.
Vertex perturbation in apoptosis network. The graphical representation of cellular fates obtained after perturbation of node is shown. The OFF state of anti-apoptotic nodes such as AKT, BCL2, NFκB cFLIP, and IKK resulted in significant apoptosis states (red color). However, perturbation of pro-apoptotic nodes such as CASP3 and CASP8 resulted in maximum survival states (blue color). In case of BCL2, BID, BAX, and CYT-C mutation, few states were observed in DNA repair states shown in light green color.

